A Tour of StockWave
The main elements of the StockWave application are described as follows.
The Main Window
The main window shows a list of all the stocks
currently monitored. If you click on the name of
the stock, this will select it; once selected, a
right-click will bring up an options menu from
which you can select further information.
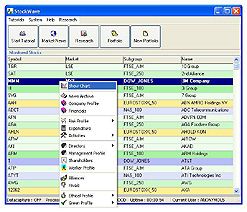
The buttons at the top of the main form allow the user to access tutorial information, open his portfolio or go to the company research functions.
The drop down menus duplicate the large button functionality while adding more, less often used, options. The tutorial menu allows direct access to each of the individual help and tutorial files; the system menu allows the user to bring up the datacapture, task processing and system management windows; it is not always desirable or necessary to have these open and the user should bear this in mind — customize the user interface to your own requirements, show or hide windows as you desire, have the desktop as neat or as cluttered as you want.
The help button allows the user to search on any topic, either within the local documentation or on the Internet.
The Advanced Edition has an extra button called research; this contains the functions relating to the companies database and includes query, datamining and visualisation capabilities. There is also a sophisticated Web agent facility; this allows the user to go beyond the normal abilities of the search engines when looking for specific company related information — the program reads the entire contents of Web pages and can make a judgement as to the relevance and interest of a page; it also guides its surfing based upon a ranking of the pages it has already visited — you don't have to surf the net, it does it for you and simply reports back whatever titbits it has found!
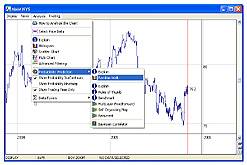
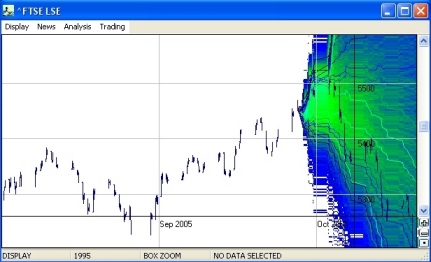
Stock Chart
Once a stock is selected in the main form, a
right-click will bring up the options menu; if
you then click on the top button, a chart of the
share price will appear. The stock chart is in
many ways, the most important form; since we
believe the actual time history of the share
price is the most important piece of data, we
have arranged the main functionality and other
data access around it; almost all the interesting
'action' will be based around the chart.
Since the chart has a lot of functionality associated with it, to keep the interface neat, we have put access to this on the drop-down menus; in practice we believe you will work your way along the menus in a left to right, and top to bottom fashion — just like reading.
The chart displays both end of day and intra-day data in a unified fashion; you can zoom in and out, scroll left-right and up-down. There is also a reset button which takes you back to the original display. Right-clicking on the chart brings up an options menu; this lets you go back to you last zoom position, or choose from a number of default viewing positions; there is also the ability to change modes into data or news select modes. The 'load more data' button does exactly that; since we are dealing with both intra-day and end of day data over a wide range of resolutions, it is not sensible to load all the high resolution data all of the time, thus the default behaviour on opening a chart is to load only the end of day data, plus very recent intra-day data; when you press the load button you are forcing the loading of all high resolution intra-day data within the current viewing window.
The seamless multi-resolution ability of the chart is an important feature to be aware of; the application was designed to be able to handle data of any resolution, from daily down to second by second; this allows users with different data access capabilities to be accommodated. Many programs aimed at the small investor use only end of day data, since it is usually all that is available, but we believe that higher resolution data is preferable for our advanced algorithms to work on, and so we encourage the small investor to go beyond end of day systems.
The chart has a number of modes associated with it; these are display, data select and news select. In display mode dragging actions will zoom the display while in selection modes they do not; data select mode will choose a section of the chart data to be used for further data processing; news select mode will select a time period, then load news articles from within that period to be shown in the news viewer, and in chart window as special annotations.
Once data has been selected it can then be used as input for the various data processing algorithms.
Something an experienced investor might notice is how clean the chart seems; it is the normal case when displaying share price information to add in a multitude of overlays, volume bar charts and so on ( — there is also a common idiom for drawing end of day data). None of these are available, and for very good reasons; to put it bluntly, we do not think they are of much use to the trader; you will not find Bollinger Bands, RSI, stochastic indicators, moving averages, Fibonacci retracements, open-close-hi-lo bars, overbought and oversold indicators, because this is not what StockWave is about! StockWave does have analytical indicators, but these are of an entirely different character than these other methods, but more of that later.
The first drop down menu contains options for customizing the look of the application; you can change the colour scheme, the drawing algorithm, the zoom method; you can show percentage moves relative to the current price, or have an inspection facility which shows the date, time and value under the current cursor position.
Next of the menus is the news menu; every
chart has an associated news viewer and
annotation features, this allows the user
to place significant news events in relation to
share price moves, which can be a powerful
explanatory mechanism in itself. Advanced
versions of StockWave will incorporate techniques
to assign quantitative measures of importance to
news events.
The third menu is the most interesting; it is
here that we access the analysis tools;
after selecting some data the user can access
powerful data processing techniques in order to
generate a prediction about the stock. It
is in this regard that StockWave is radically
different from the usual technical analysis
packages; all of the StockWave data processing
algorithms, which we call predictors, will
generate overlays which show the isocontours
of probability for the stocks future price
moves; (that was a bit of a mouthful!) to put it
simply — the overlays in StockWave lie in
the future of the share price, and they
show chance that the share price will
achieve a certain value, so, e.g. by simply
looking at the chart we can say 'there is a
74% chance that the FTSE will go below 3800'
etc. It is this which lies at the heart of our
trading system, for with that information you can
then make some trade which maximises your
profit potential.
The next two menus deal with aspects of trading; the first deals with derivatives and links to tutorials, plus the common exchanges. Derivatives are crucial to StockWave in that they allow you to make a profit whatever the direction of the market — as long as you have chosen the right direction (which is where the probabilistic predictions come into their own). Buying stocks is simply too inflexible (stocks go down as well as up!) and costly (stamp duty, brokers fees) for the small investor, so we discourage it.
If you have made a trade, it is necessary to monitor it, i.e. to have an idea whether it is in profit or not, or if not in profit, at least on track to make a profit. This necessitates further overlays; these are simple regions which are associated with an active trade, and are colour coded to show the status of the trade — green means that the trade is on track to make a profit and red means, obviously, that the trade has become seriously deviated from its profit target. The purpose of these overlays, along with an associated automatic warning system is to encourage the trader to cut losing positions quickly, and to take profits in a timely manner; hanging on to positions for too long is a common mistake and one way the spread betting firms and brokerages make lots of money.
Portfolio
The portfolio contains the user's trading
interests; clicking on one of the top buttons
will list the information in the table below.
From here you can see a list of all the
trades you have made, the status of your
broker accounts, plus any trading
warnings you should be aware of.
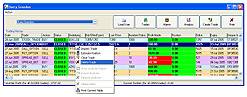
In the commercial version, the drop-down menus also give access to other analysis tools, not accessible from the stock chart.
The last button on the right of the form will take you to a very important window — the Trade Creator window.
Trade Creator
From the users portfolio he can access the trade creator window once he has made the decision to trade. The trade creator form is a little complicated, mainly because it allows you to do complicated things. To use the form, again we work left to right and top to bottom; when having decided to make a trade it is crucial that one has some analysis upon which to base ones decision; in the middle top of the form we have menus for selecting a stock of interest and some predictor we have created for the stock in question. You cannot make a trade without having done some analysis, and when you come to trade you will be selecting whatever analysis you feel most belief in. Once selected, the predictor curves will appear in the top left window.
Now we can construct some trades!
Bear markets mean that looking for stocks to buy
can be a thankless task; with derivatives
overall market direction is of no consequence,
and commissions will be lower than for stock
trades. There are a number of types of
derivatives trade available to the small
investor; from the middle section of the form we
can select a trade type to make. A small form
will appear asking for the parameters of the
trade; since StockWave does not have any link to
any online brokerage (which is a good
thing as we thus remain unbiased) the user
will have to find the parameters from a suitable
brokerage or spread betting firm. Once you
fill-in these parameters, the trade will appear
in the central table, and some new information
will appear along the bottom section of the form;
you will see payoff graphs, and summary
performance measures for this chosen
trade.
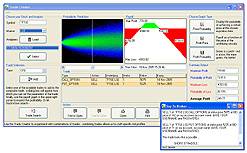
Derivatives trades can be very difficult to understand, so StockWave gives you a big help; for any trade whatsoever, and given a predictor for the underlying stock, it can calculate probabilities of profit and loss. These are displayed on a chart; red means a loss is indicated and green means a profit. The summary measures give overall performance figures — the probability of making a profit, the probability of a loss, the maximum profit and loss, and the expected loss or profit.
Now the fun can really start; this is all very useful when done for a single trade, but StockWave takes it further; you can add another trade to the one you have already entered, and StockWave will calculate the payoff parameters for the combination. What is more you can add as many trades as you wish, or remove ones you have already entered.
It is now that a whole world of sophisticated trading strategies becomes available to the user. If you have browsed the glossary you will have come across many strange and exotic things, some of the strangest are the names given to various options strategies; good news! — you do not have to learn what these are — by simple process of experimentation the user can see what works and what doesn't; what increases the profit level, what decreases risk and so on. And whatever you do, the forms output is very simple — the chances of profit and loss, always.
At some point you may have found something you want to trade; ideally online execution would be best for this, but is not yet available, so you will have to make a verbal instruction to your broker; to help you with this you can get a print out of the entire trade, written in such a way that verbal instruction will be understood.
Lastly, two small warnings — be aware of the trading charges being levied against you, and how these are calculated for doing combination trades, i.e. do they charge you several times over, or do you only get charged once; details like this can matter a lot when one is trying to make a small profit.
The second warning is an encouragement for the user to close out his positions in a timely manner, i.e. be disciplined. It is tempting to leave a trade running longer than you intended to, either because it is in profit and you become greedy, or because you are making a loss, but are hoping that, somehow, the trade will recover.
When you commit the trade, it is saved to your portfolio and an automatic alarm is created in the system — this will monitor the approximate progress of the trade, and warn you whenever the trade is trouble, or has reached you profit target. Alarms can be sent via mobile phone text messaging; the danger and safety regions of the trade can also be seen on the stock chart of the underlying stock.
Once committed, the Trade Creator will disappear, taking the user back to his portfolio, which monitors overall positions for all trades made.
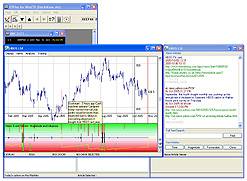
Data Capture
The datacapture window is one which the user need
never see; it is accessed from the system
drop-down menu of the main window. In the
datacapture window you will see a table which
lists the currently monitored datasources; both
price and news data can be monitored. The
datacapture process runs in the background,
allowing the user to use the application normally
without any freezes or interference.
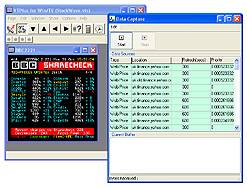
Prices can be extracted from teletext, or from the internet; news is taken from the internet. Once a piece of raw data has been gathered, the capture processing algorithms set to work, extracting share prices, or interesting news articles which are then saved to disk. The user can watch this datacapture process happening in real-time from a stock chart.
Data type and update rate can vary a great deal; one of the problems facing the small investor is in simply obtaining any data at all. Mostly, the big data providers want you to sign up to a data subscription service — this could be £100 a month, with your internet phone bill on top. In other words, a lot. Because of this, StockWave is designed to be able to use free datasources, from wherever and of whatever variety, which means it has to be highly configurable. This meant many headaches during development — if you know what the datastream is, and it is reliable, then the programming task is relatively easy; having to be able to extract meaningful information from anything at all is a much tougher task, but algorithms were developed to do this.
From the drop-down menus the user can choose from several default configurations, tailored to his computer system and geographic location, or he can create new custom datasources. With the final adoption of widespread broadband internet connectivity and flat rate monthly charging, there is finally the chance that the small investor will have almost the same access to data as the market professional — this is truly a great opportunity, as at last, there is a levelling of the playing field. But there is something of a problem here; many companies are desperate to make money from their internet operations, and since pop-up advertising has failed, they are beginning to resort to more traditional business model — i.e. pay for view subscription services for 'premium content'. It is here the flexibility of StockWave comes to the fore — if you can gather small pieces of information from a number of sources, then you can combine these to create an accurate overall impression, and all without having to pay!
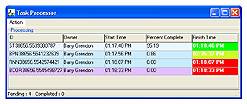
Task Processor
The creators of StockWave scoured the fields of science, engineering, and AI, looking for data processing techniques appropriate to stock trading; we chose the best, and modified these, sometimes extensively, to our own ends, plus we invented a few of our own as well. The end result is quite a toolkit.
There is a big problem though — many of these techniques are not cheap in computational terms; in fact some are very heavy indeed, and without the great advances in personal computing power would not have been possible at all; StockWave could not exist 5 years ago.
With StockWave, you can do some truly hardcore
number-crunching, for example Monte Carlo
simulation is at the heart of much of the
analysis tools. Because of the possible running
times of these operations, they are designed to
be performed in the background, and the task
processor is what provides summary information as
to the status of the various jobs you might have
running, as well as being able to start, stop and
even delete them, if they are just taking far too
long.
System Manager
Because of the large variation in the
capabilities of user hardware, and the wide
variety and intensity of the processing
available, we provided the system manager as an
aid to the user, to let him gauge how easily or
otherwise his machine is coping with the demands
being placed upon it.
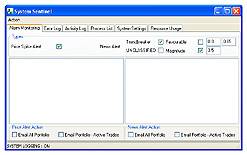
Later versions of StockWave will be introspective in that they will be aware of their own situation, and will be able to make adjustments to their operating parameters to optimise their performance.
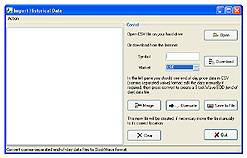
Data Import and Download
A commonly available format for stock price data
is end-of-day CSV (comma separated value); if the
user has obtained such data he can import it to
the StockWave EOD format and from there see the
data charted or used in data processing. Other
formats are not supported.