How to Analyze Chart Data
![]() �
What not to do and why you shouldn't
�
What not to do and why you shouldn't
Generalities
Share price movements are generated by the actions of traders and investors trading; the market traders are trying to predict which way the market will go in order to make a profitable trade, to help them do this they watch the chart of the share price and study the news feeds for any important developments; at longer timescales other investors will be trading stocks as well. The combined effect of all these individuals' trading activities at both long and short timescales gives rise to the movements of the share price — these can be wild and erratic in the extreme.
Obviously, the smaller investor is a player in this game too, and with exactly the same objective as everyone else — trying to make a profit. So, how can he make sense of it all? The first place to start is with the price chart itself.
![]() �Top
�Top
Getting Visual
Unfortunately, there is no scientific law we know
of which governs market behaviour, but knowing
something of the mechanics of a process may help
us to understand it, even if the outcome —
the price chart — seems mostly random;
remember that our overall objective is not for
some theoretical insight as a scientist might
wish, but a more practical one — we know
that to trade successfully over a long time
period we need to be on the right side of any
market moves, more often than not. To begin with,
just use your eyes. Look at the chart
— the combined eye-brain system is the most
powerful visual processing computer ever created;
90% of our brainpower is devoted to vision
processing, so take advantage of it.
When you look at it, the chart will look very random and irregular, with a great many sharp jumps and corrections; focus to begin with on the highest peaks and the lowest troughs. Between these highs and lows the chart should look slightly more regular, in the sense that the irregularity seems to have a constant character. Great peaks and troughs can sometimes be thought of as fracture points — very often a large reversal in the chart is the result of a piece of important news, the impact of which is to change the underlying character of whatever process was generating the share price movements for that period. These fractures show where there have been 'shocks' to the system.
![]() �Top
�Top
News and Causation
Focus on these very largest peaks and troughs and
look for significant news events around these
times; it is likely you will find that some big
news events have generated these changes —
they should not be too hard to find; this is the
way the market works — news events happen
continuously, some small, some large, the impact
of which gradually filters through to the share
price, but this does take time — it is by
no means instantaneous. Use the news annotation
feature of the stock chart to show the occurrence
of the news events in relation to these market
moves.
It would be nice to think that we could match up every price move with some news event, but mostly we can't; sometimes there are no significant news events available to 'explain' a move, and there are many news events that do occur which will seem to have no discernible effect either way. These small events can be safely ignored as a statistical analysis of the share price can incorporate the effects of these kinds of events.
![]() �Top
�Top
The Statistical Approach
Identifying the kinds of large news events which result in the so-called fracture points allows us to calibrate what kind of external events will cause these large moves but which cannot be incorporated in any timeseries analysis; this is an unfortunate but genuine phenomenon — there are news events which matter, and those that don't, plus those whose effects can be accounted for, and those which cannot, at least with current techniques. Anything truly unexpected which cannot be handled by the more common timeseries analysis techniques we shall call a trend-breaker event.
Between fracture points, it is a reasonable assumption to regard the share price as being, in a statistical sense, 'regular.' In this case one can apply some timeseries analysis algorithms to the data to generate a probabilistic prediction, bearing in mind that large trend-breaking news events are likely to invalidate any such prediction.
To recap — there are thus two types of news event, those which we do not need to worry about as their effect is already accounted for in our statistical analysis, and large, external, unpredictable events which need to be monitored for. Identifying the boundary between these types of news for a given stock is very important — for the moment it is sufficient to know that it exists. These trend-breaking news events obviously create a problem for any analysis as they are relatively infrequent — there is thus too little data to apply any methods of statistical analysis to them; in some cases their effect is so catastrophic as to result in a complete disaster for the company, and so we have the situation where the event can only ever occur once. But many of even these very large, news events will not result in total collapse, and the question is then to what level will the share price be depressed and how long will it take to recover — this is an extremely difficult thing to calculate. For immediate practical purposes, it suffices to identify trend-breaker news events (StockWave™ will soon incorporate news filters which can judge the approximate magnitude of news events), and to take defensive action when they occur.
In theory at least, these large news events actually present a trading opportunity for the investor — when big news events break there is a widespread tendency to over-react, usually in a negative way. If in such a situation you had good cause to believe that despite the current bad news, the share price would recover, then the currently depressed prices would be a good buying opportunity — the classic contrarian strategy. Techniques are currently being investigated which would allow us this ability to potentially 'trade through chaos,' but are as yet unavailable — for example, suppose we have an open position, based on the assumption of a correct analysis, and an important news events occurs; if we know the event is not of the 'trend-breaker' variety we can be confident of holding our position open, even extending it.
To summarize — statistical data processing techniques can be used to generate probabilistic estimates of share price moves, but one must remain aware of the possibility of severe and unexpected moves which cannot be accounted for, at least not with current technology.
![]() �Top
�Top
Practicalities
This is the theory of it all, but what of the practicalities of using StockWave™?
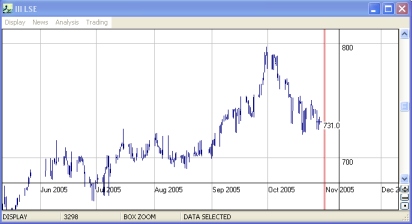
To analyze chart data in StockWave™ you
must first choose some data to be analyzed; this
is done by entering SELECT_DATA mode from the
stock chart, then sweep-selecting a region of
data. A dialogue box will appear to ask you for
further parameters about your selection. Once the
data has been selected, click on one of the
analyzer buttons; fill in the parameters for it,
then send the job to the task processor by
clicking on CREATE. When the job is done it will
usually draw the predictive isocontours
automatically on the chart. And that is it! You
have now done a statistical analysis of
the share price movements, using a scientifically
sound technique, with just a couple of clicks of
your mouse.
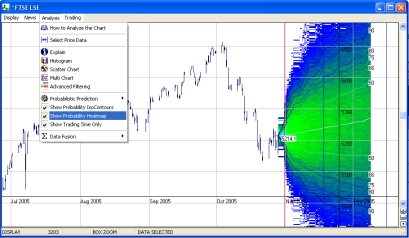
The contours of the predictor curve represent areas of probability, i.e., between the two 50 lines there is a 50% chance of the share price remaining within these lines, and so on for the 66, 75, 80, 90, 95 and 99 lines. If you want you can interpret these as being the true odds for the share price movements and use this to trade. For example, suppose you chose the 99 line at a certain time (being the expiry date of an option); believing that it is 99% certain that the price will remain within this range, you can then safely sell ('write') options at the strike price indicated by the contour line, knowing it is unlikely (less than 1% chance) that the option will be exercised and allowing you to pocket the premium, with little risk (the details of options trading may seem a little bit daunting to you at present, but all you are doing in this case is making a bet on where the price will not go.)
![]() �Top
�Top
Types of analysis
It is very easy to use — just sweep-select the data you want, then click on the analyzer you wish to apply.
Note that there are a number of different kinds of analyzer in StockWave™ — if you are technically minded, the underlying techniques that are being applied should be obvious from their naming. What they actually do, does not need to concern you in practice — all you need to know is that they all will produce a probabilistic prediction about the market. What you will have to do is to play around with them, getting a feel for what works and what doesn't, seeing which methods agree and which don't. This is a matter for experimentation and developing one's intuition — but this is not to say we are back to guessing the direction of the market, we have advanced a long way from this. If you want to know the actual details of their individual operations we suggest that you consult an authoritative reference — StockWave™ is meant to be a practical tool, not an academic exercise. Use the methods we give you, find out what works, then use it; don't get wound up on what it does or does not do — if it works, use it, make your trades and take your profits.
The basic idea behind all analysis methods is that somehow we wish to fit a curve of some kind through the set of data points, and, if this curve is the 'right one,' by extrapolating it into the future we can make a prediction. However, there are any number of ways to fit a curve to a set of data points, and what we need to progress are further assumptions about the underlying process which generates the data. The choices one can make for this underlying process result in the different choices of analyzer. It should be stressed that we can never actually know what this underlying process is, whether such a thing exists at all, and even if we did know it for certain at this time, it is likely that it would change its character in the future; this is not mere pessimism, but practicality — in trading on the markets we are not seeking to find some great secret, some Universal Law of Share Prices, we simply want to play the odds better than the next guy, and so in the long term, turn over a nice profit — let's leave the theory to the academics; we'll just count our cash.
To get the best results in practice one should analyze the chosen timeseries with a number of methods, and also vary the parameters of the analyzers as well — what you will get are a set of predictors — the objective is to find corroboration among the methods. If you find however that this set of predictions is widely varying, then there is a need for caution, but it is still reasonable to proceed using whatever seems the 'best,' and furthermore, even if all the methods roughly agree, this being thought good sign, there is still a need for caution — one would hope that several independent analyses would be unlikely to be very widely wrong, but it is still possible. An especially important point about using the analyzers concerns the choices of data one uses to apply them to — this requires some thoughtful experimentation.
![]() �Top
�Top
What not to do and why you shouldn't
Consider the following scenario; a naïve user begins to use StockWave™, without bothering much with the tutorial material as he is impatient to make money — he sees that there are predictive algorithms available and immediately he wants to get the most accurate trading prediction for some stock; to get the best prediction he thinks it is best to use as much data as possible — both in terms of its granularity or its history. So suppose for example our user has the FTSE or DOW, at one minute intervals going back to 1970, he then selects the data — selects all of it — and chooses an analyzer, hoping to get a minute-by-minute prediction for the next year or so and with this golden knowledge proceed to become a billionaire in a short space of time.
No. Very unlikely, and quite wrong.
Let me explain why.
Firstly, with such a large data set it is likely you would have to wait a very long time for your prediction, though in principle it could be generated, but there is a much more serious problem.
When you submit a data selection to an analyzer, you are making an implicit assumption that all of the chosen data is relevant, and that whatever underlying process is at work to generate the numbers, does not change significantly over the selection period — this question of relevance can only be settled by trial and error. Empirically, one may note some properties of timeseries that seem to arise naturally — one of these is the predictive horizon; what this means is that when you are trying to predict, no matter how much data you have in the past, beyond a certain future point, the predictions will be useless. Another feature is the relevance horizon — this is the point beyond which adding past data does not improve the predictions of the model. Between these two points one would hope that one has sufficient data, and a process which is amenable to our techniques — i.e., a significant time period between the two horizons; as an extreme example, a truly random process should have overlapping predictive and relevance horizons — we cannot predict at all, no matter how much data we analyze!
The practical consequence of these horizons for our analyzers is that while being trained for the pattern recognition task, if they are fed a lot of irrelevant facts, then they effectively become 'confused' and thus their usefulness as predictors is degraded. Garbage in, garbage out.
The chart and the newswire are not the only thing we have to think about; we have another source of information, namely fundamentals, the starting point of which is the company report.