Quick Start
The following is a stereotypical example of how StockWave™ would typically be used.
Start the Application
Decide what you want to do — look at
tutorials, browse the share price and company
information, or go straight to your portfolio and
start trading.
Start Tutorial — links you to a set of Webpages which explain the history and mechanics of the stock market; what you need to know to get you started. Background material.�
Market News — shows where todays market action is and recent news stories from the mainstream financial media; this is a useful starting point for further enquiry.
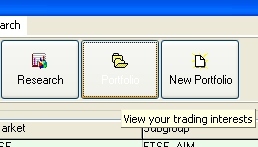
Create a Portfolio — a portfolio holds together your individual trading interests; trades you've made, analysis you've done, your broker accounts.
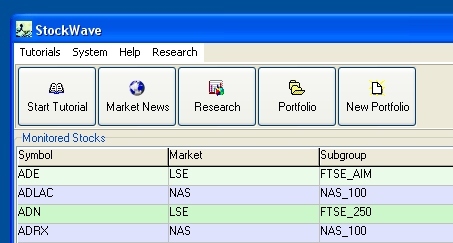
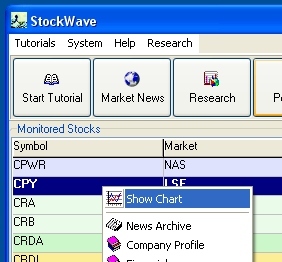
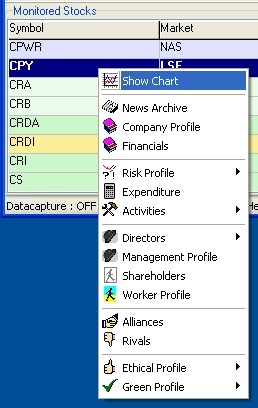
Choose a stock by clicking on its entry on the
main grid; if you then right-click you will get
further choices.
Research — use this to search the internet for useful chunks of information.
Open a Stock Chart
Customise the look and feel; check the news; do some analysis, get a prediction about the market.
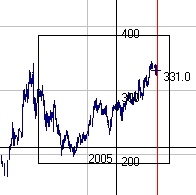
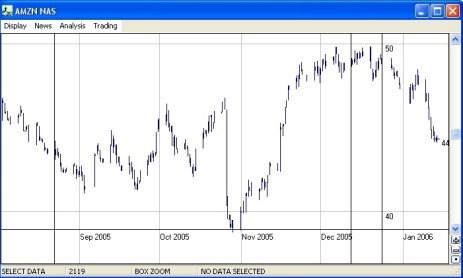
Select a region of interest — zoom in to
where the action is
Change the look — choose a different colour
scheme
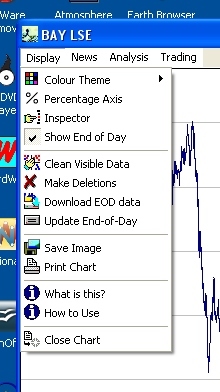
See the news events in relation to the market
moves
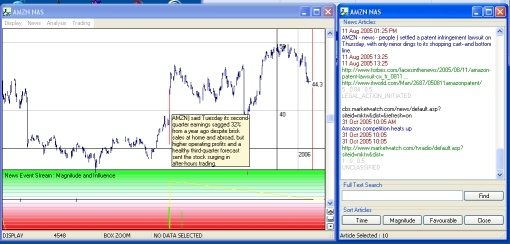
Select Data — drag from the left edge of
the desired range to the right extremity.
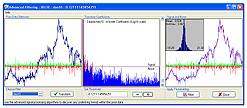
Use the data selection to so some analysis
— check the price move histogram, open the
advanced filtering tool or run a Monte Carlo
simulation to create a probabilistic
prediction.

Check other Information
Automatic queries can be created from the context
menu.
Open your Portfolio
Create a new portfolio if you do not have one
already — you need to enter your name,
email address and phone number.
Once your portfolio is open, you can proceed to
analysis and trading, in particular you can
create probabilistic predictors from the Monte
Carlo tools on the StockChart menu.
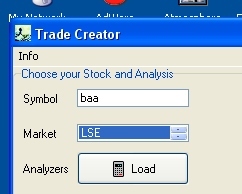
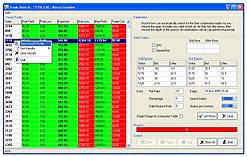
Go to the Trade Creator
This can be used to craft complex trades; work left to right, and top to bottom.
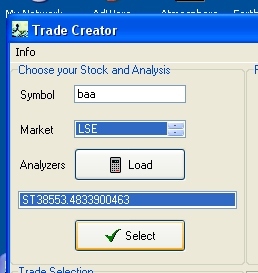
First of all select a stock of interest
— you need to enter its symbol and market
designation. Trade Creator will then check your
portfolio for any available analysis for this
stock; if it finds any it will load it to the
analysis list.
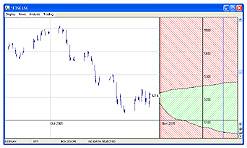
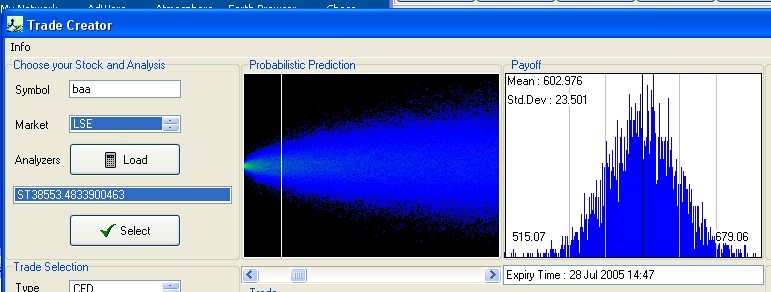
If the analysis list is non-empty you can load
one of the probabilistic predictors onto the
form; a two dimensional image will be loaded onto
the middle left hand panel — the colours on
this image represent probability; the brighter
the spot, the more chance of the price achieving
that given value. The contour lines represent the
concentration of probability, e.g. between the
two 50 lines, there is a 50% chance that the
share price will be bounded by these lines. The
analysis we have chosen should represent our best
prediction for the future share price — we
are going to use this to evaluate the performance
of the trades we create (NB the analysis can be
changed if we want to see a 'different
opinion').
When trading we assume that it will be for a
finite time only (no 'buy-and-hold' here!)
— we wish to open a trade, let it run for a
while, then close it to realize a profit;
select the implied closing time for the
trade we are about to construct by sliding the
scrollbar underneath the middle left panel; on
the middle right hand panel you should see a
histogram — this is a one dimensional slice
of our two dimensional image and shows the price
probabilities for the current stock at the
selected closing time.
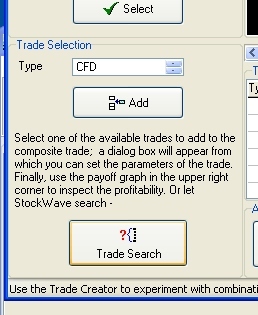
Next, select a trade. On the bottom
extreme left panel you will see a drop down list
which contains a number of trade types —
these are ordinary stock trades, CFDs
(contracts-for-difference, this is a derivative
which simulates a stock trade, but without the
stamp duty), spread bets and options. Choose one
of these types; a form will appear containing the
trade parameters. Currently you have to set these
by hand, but its not too hard — the main
thing is to get accurate current bid and offer
prices for the trade, possibly from an online
brokerage, and set reasonable estimates for the
transaction charges you will incur. One the
parameters are entered, we can get our payoff
graphs.
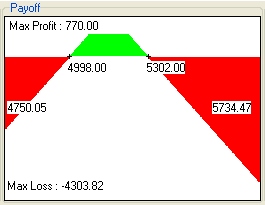
Once the trade parameters are entered the program
can calculate the profit and loss figures for any
closing price; you can see this by looking at the
profit-price graph on the middle right
panel — red represents a loss and green
represents a profit; from this we can read off
our profit and loss regions, and also find where
the breakeven points are. But we can go even
further than this.
Remember from our analysis we have the price probability at the closing time; and from our trade selection we have our price profit graph — by putting the two of these together we can produce a profit probability graph. This is the crucial point in our analysis for it tells us very concisely all we need to know, and from it we can produce summary measures that tell us what we really want to know, i.e. how much do I expect to make, what are my chances of making money, and how much could I lose?
There is more to the Trade Creator than even this; we can use different analyses if we want to, and we can build composite trades. Composite trades are combination trades crafted specifically to take advantage of current market conditions. Combination trades can be made with Trade Creator — all the payoff calculations are done automatically.
And yet there's more... rather than spending a
lot of time hand-crafting a trade, why not use
the AutoSearch facility. You start by
entering a number of basic trades to seed the
algorithm, then it exhaustively calculates the
payoff measures for all possible trade
combinations, producing a summary list of the
best trades found as its output.
Make a Trade
Check the Payoff Graph — if you like the chances of the return, then make the trade.
Set your Alarms
Once a trade has been made a trade alarm is set
which warns you if the price is moving badly
against you.