Technical Analysis is Bullshit : Trading Systems and Indicators - Just Don't Work!
It's amazing and frustrating how resilient many bad old ideas are - some things just won't die, they just get resurrected and repeated for a new generation of "marks" ...
... like the way the bankers broke the financial system, for which crime they are ... given mountains of money and asked to try and fix it [0] (- if they wouldn't mind) by doing exactly the same things they did last time, which caused all the trouble [1] ... (except in Iceland) ... now consider an outbreak of rapes and sexual deviancy ... do you find and convict the rapists? or do you form and fund a committee of rapists to try and sort out the rape problem ... why not? - after all, aren't these men the experts in the matter with an intimate understanding of the problem ...
- ...ahem... some hyperbolic diversionary ranting there, but I am coming to a pet peeve of mine : Technical Analysis, which is undergoing a revamp and revival due to a new generation of web based trading, system building and backtesting platforms; "not all this crap again", I think to myself.
Technical Analysis (TA) is analysis based on things like moving averages and "oscillators", the full indicator zoo is measured in the hundreds, something for everyone, and everyone has a favourite!
Trading Systems (TS) building is trying to find some "magic formula" / combination of the above, which acts as your trading signals generator; you then write a computer program to trade using with this and call it "automated algorithmic trading"; this is seen as the height of sophistication - you can even publish, and sell(!), such systems via a new generation of web platforms, incorporating all the latest web standards and frameworks, and of course, somewhere along the line, using the "cloud" ... (- and naturally the stock spammers, the options "gurus", the investment advisors, the financial "tech entrepreneurs" are all over facebook and twitter providing a continuous torrent of spam to all and sundry, using the dumbness-of-crowds techniques of mutual recommendation and consensus, to boost themselves to the top of the charts ...)
Let's quickly demolish the foundations of this old / new religion -
TA indicators do not extract any more information from the price timeseries, they actually destroy it; you are better off learning directly from the data. Note also when trying to extract predictive information from a timeseries you have the phenomenon of the relevance horizon and the prediction horizon to think of; whatever your indicator is, while it may look nice, it is giving you less than you think it does.
TA indicators are typically drawn over the past history (- lagging indicators only; are there any leading indicators in conventional TA?), but the future is what you want to know about; now you can't "predict" (- an undeservedly dirty word in finance and economics) with exactitude, like a crisp future trajectory, but you can get a probability, i.e. the chance, the true odds of future price moves - and that is all you need to trade on.
TA indicators on their own, just don't work, and so people try and combine them in interesting ways; but this is needle-in-a-haystack territory. Some commercial and expensive software adds an optimising search facility to generate this "magic formula" for you automatically, and which will seem to work because you will then backtest it on past data - now you may say "why not use it anyway, it works, that's all we care about" - yes, but the reason "it (seems like it) works" may be shallow rather than deep, i.e. it's really just an accident, a side effect of random phenomena, which means it will have no predictive facility. Again, saying it till I am blue-in-the-face, the future, the immediate future - trading at the current moment and looking forward - is what we really care about; what happened in the past is done, dusted and over, and the really long-term future is impossible to know, barring one thing only - the inevitability of your own death!
Here's another kick in the ribs, to try and wake you up, spill that Kool-Aid bottle from your hands ...
Backtesting is bullshit as well; now you probably think that backtesting is the gold standard of scientific rigour - it isn't. Not only do you have the previously mentioned horizons to think about, but there is also the uncomfortable fact that markets are ever-changing, they are adaptive ... whatever is "going on" right now is unlikely to be the same as what went on 2 years ago, and certainly not 5 or 10 - this is because the market participants are themselves learning and changing their own behaviour, most of which are no longer even human, the algo-bots, trading and front-running at high frequencies, flash-crashing as they do. Markets have no universal, unchanging "law" which governs them - this is not physics, nor mathematics - its just, at the end of the day, emergent collective behaviour, i.e. human beings ... "fucking around" ... of course share prices at some point represented the ability of companies to make profits, doing stuff that was relevant to the real world, the wider economy, "supply and demand" and all that shit-that-really-exists ... now they are just phantasms, spectres of misinformed or uncaring belief in the casino of smoke and mirrors.
Backtesting returns are based on the idea of blindly trading your system for a long period - but the markets are always changing their behaviour, so why would you want to do this? It would be insane; resolutely holding onto your system for a long time in the belief it will turn around is unlikely to be fruitful, or good for the nerves - you want to get in, make a profit, then get right back out again. The best we can possibly do is to use our computational resources to find "patterns", "correlations", local time dependent "effective" rules and theories which may allow us to discern some non-randomness in the price movements, and on that make a profit.
Signals generated by your trading system usually have little indication of their strength and do not have any probabilistic information; my smoke alarm sometimes goes off for no reason, even when there is no fire, not even a steak on the pan.
Filtering share price data is not the same, conceptually, as is done in the physical sciences - there you are trying to extract the true signal or feature which has been corrupted by noise (e.g. distant starlight and atmospheric turbulence)- but in trading the "fundamental reality" is the price itself, there is no underlying reality to be extracted, in other words, you are always trading the price, not the "trend". (StockWave allows you to do filtering for technical reasons involving the parameter settings of our learning algorithms, which is not the same - we may sometimes use filters to help a machine-learning algorithm to train, but that's it, and to compensate we tweak the noise in the monte carlo phase; we don't throw anything away but sometimes we choose to "slice" it in a certain manner.)
TA also totally ignores the possibile effects of news events on the price, bizarrely citing the Efficient Market Hypothesis (EMH) that "all the information is in the price" ... NB if EMH is correct then TA cannot work, ever. No one ever tries to analyse news events because its just too damn hard, extracting relevant information, tidying it up, parsing it to garner some idea of what its about, and its sense and sentiment - this is all just a pain in the neck. Much, much harder than drawing a few coloured lines on a chart, or plotting the 61.8% fibonacci retracement level. If creating a viable trading system just came down to throwing together a few moving averages, the chaikin oscillator and the parabolic sar then that would be a much easier option than trying to deal with the innate "messiness" of news stories.
Some TA software, at least in the early phase of its analysis, will use fundamentals, to pre-filter, to "scan" for stocks with gross features to act as candidates for building systems; sales figures, earnings reports, cashflow, analysts ratings etc., when they do have an impact on trading are represented in the news events stream anyway. The possible "deep" usefulness of fundamentals is probably flawed since company reports are largely works of fiction; there may useful methods of analysing collections of companies fundamentals as a whole, in order to look for interesting, statistically anomalous, situations - but no one seems to be doing anything like this.
Let me let you into a secret, the greatest secret of all trading, the holy grail[2], the system that reallly works - send no money now, just your credit card and bank account details, praise jesus ... jesus wants you to give me your money, your dollars, as well as any inappropriate photos of your teenage daughters ...
There is only one trading system which works - whats more this system works for any stock security instrument - and it works for all time
"buy low, sell high"
- and its probabilistic equivalent, which is rather less pithy - "trade when the odds are in your favour, with positive expected returns and with your stake risk-controlled ..."
We know that system works, so now the problem reduces to predicting highs and lows or rather more realistically, having an accurate probability model. So, in theory, starting from scratch with a blank sheet of paper, what is it you would try to do? Why not ... ?
- take all the data you can get hold of
- analyze it using the best algorithms you can find, adapt or invent yourself
- produce a probability as the output; don't get hung-up on crisp predictions, stick to the odds, this is what you need to trade
- find a trade which represents this expected behaviour (which may be complex and can only be found by computer aided search) and trade when the odds are in your favour
Hmm, yeah ... that all sounds pretty good - something like that, just might work - but how would you make such a thing yourself, or where could you buy it? Surely it does not exist?!
All of which takes us back around to the beginning. The software you really need and want, the best software to do trading with is ... StockWave ... or if not, then it is something which is designed on the same principles, has the same features and is functionally equivalent to it ... and since there are no such competitors around ... we get back to StockWave. One day someone may "do StockWave" better than StockWave, but it's not something that gives us sleepless nights. Now, this seems like just another "bullshit sales pitch", shamelessly brainwashing the customer - of course it's a sales pitch, but it is sales pitch by force of logic, of reasoned argument and whats more, we tell you, and no one else, no other software vendor, will ever say this to you -
Don't use our software until you've used everyone elses! Use every other piece of trading software you can get your hands on THEN use ours - try our methods; it's not the same, not similar, not even close.
If "TA is Bullshit", then what is not Bullshit?!
So what do you offer that is better than TA?
What you want is a Probability Model. These typically look like this
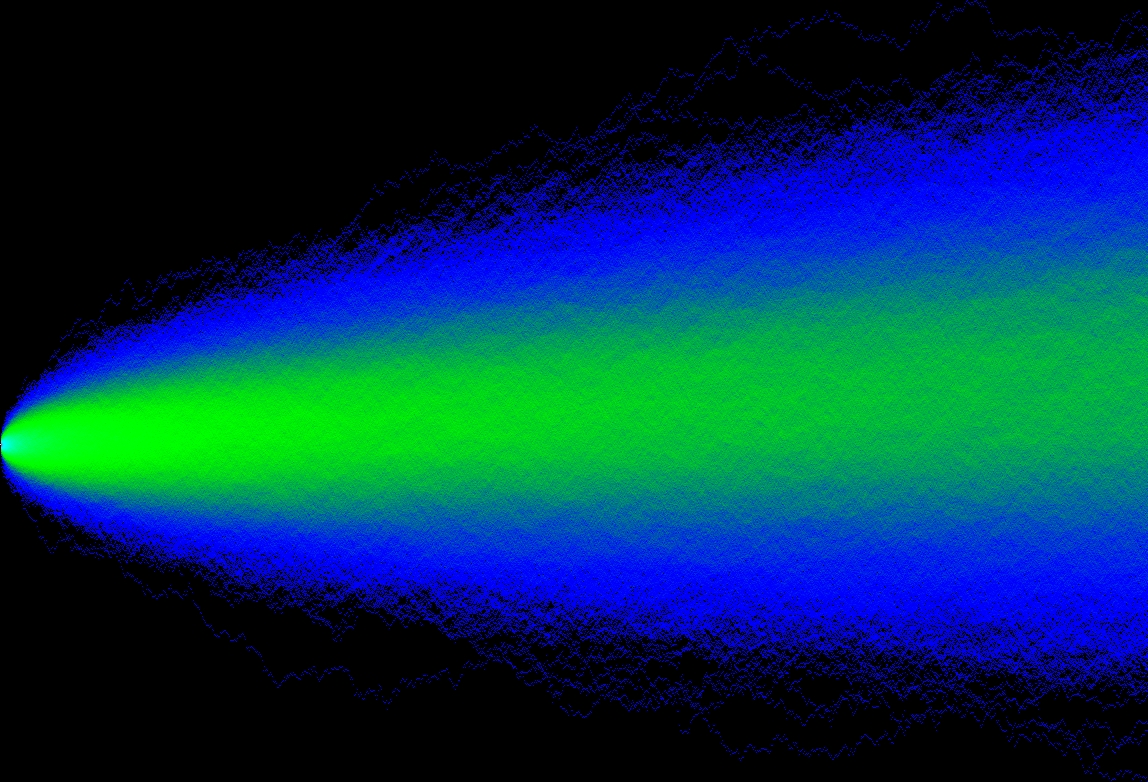
This is generated by a monte carlo simulation and is based on the mathematics of diffusion, or brownian motion - this is the kind of thing which "quants" produce for options pricing models. Note how little it gives you, how uninteresting the internal structure is - would it not be better if we could get some idea of the trend, the "wiggliness", the turning points? Of course it would, and that would be worth a lot of money - an edge that could put the odds back in your favour. And this is just what our software does - we keep saying it's not like anything else, and it isn't. You won't find anything like it, anywhere else.
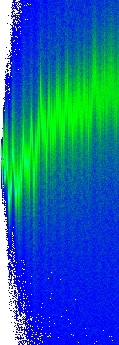
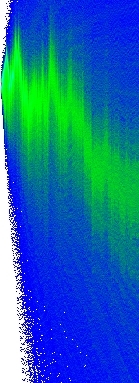
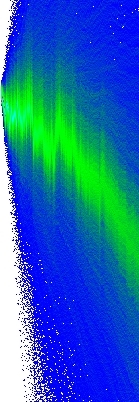
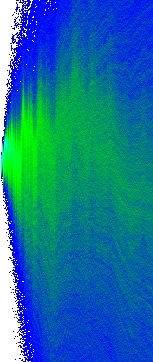
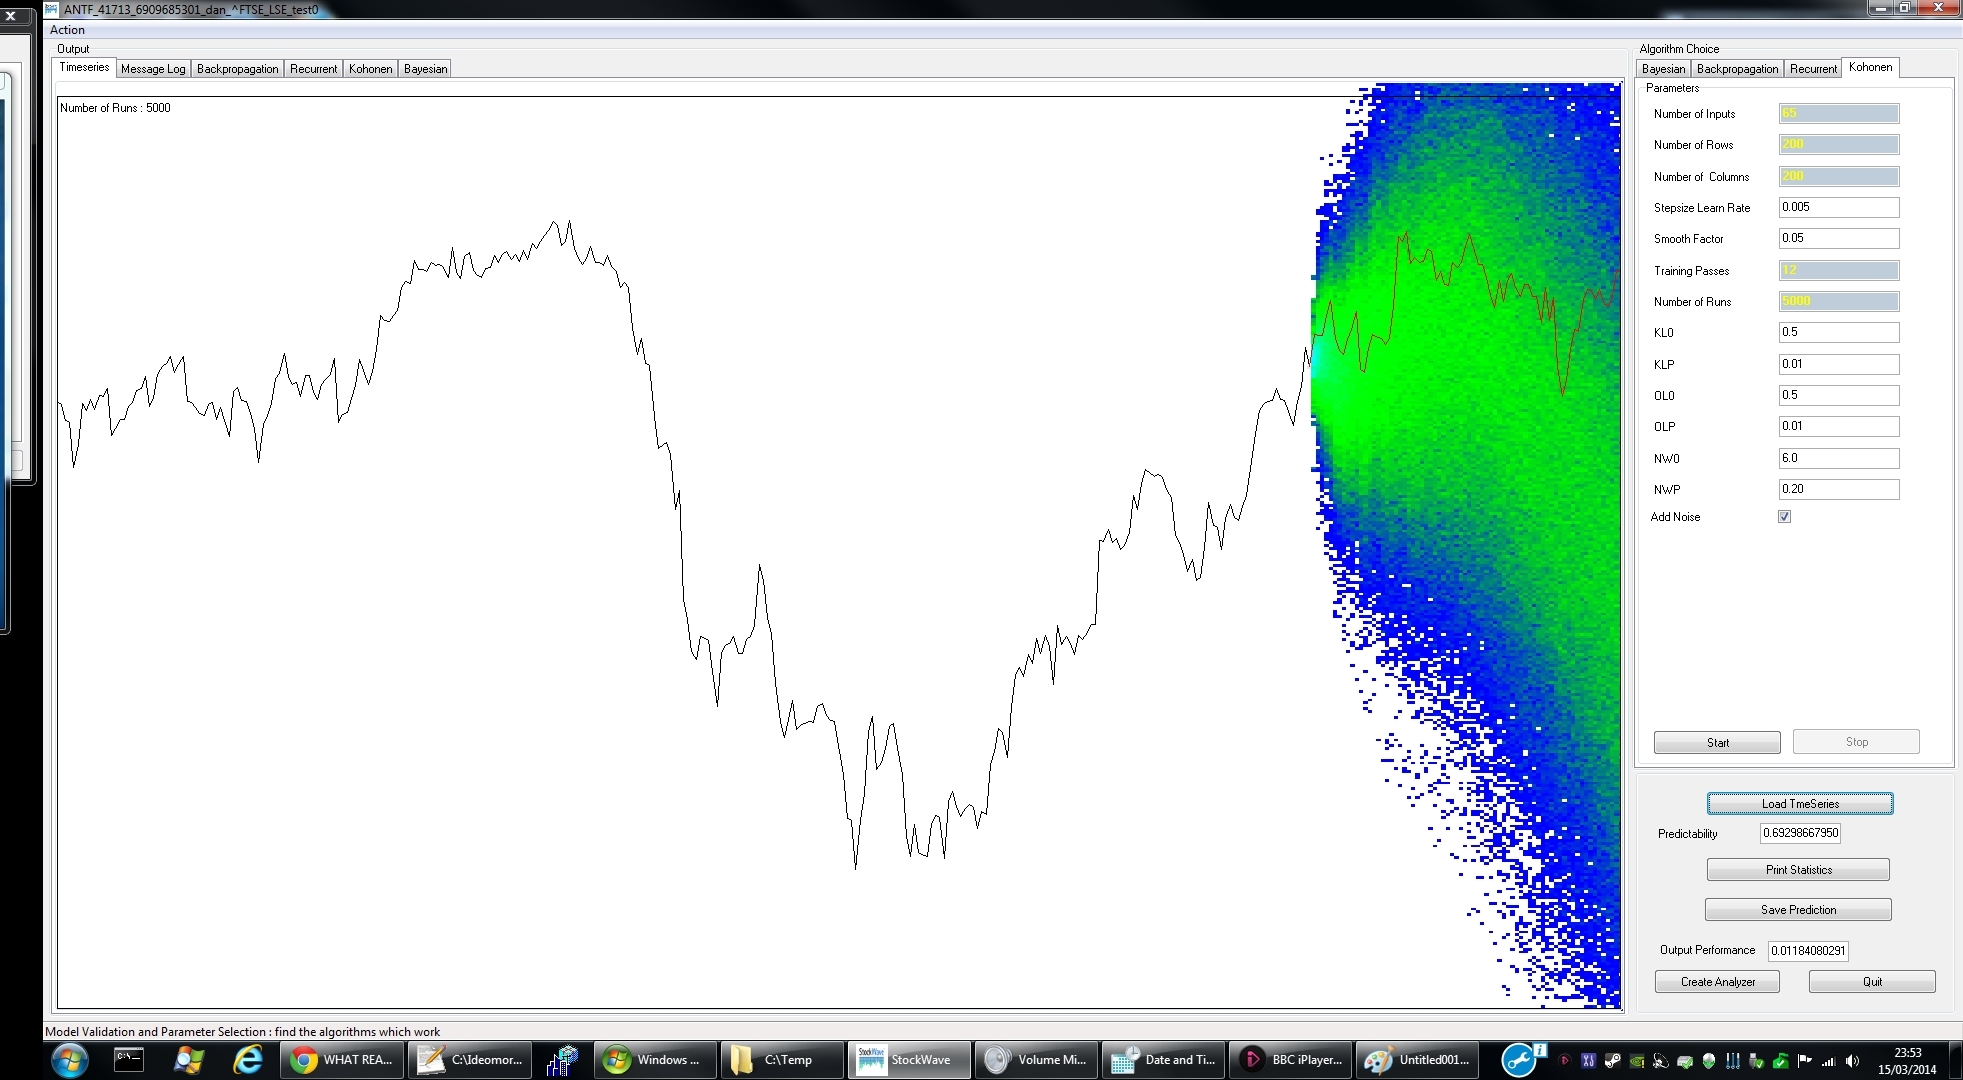
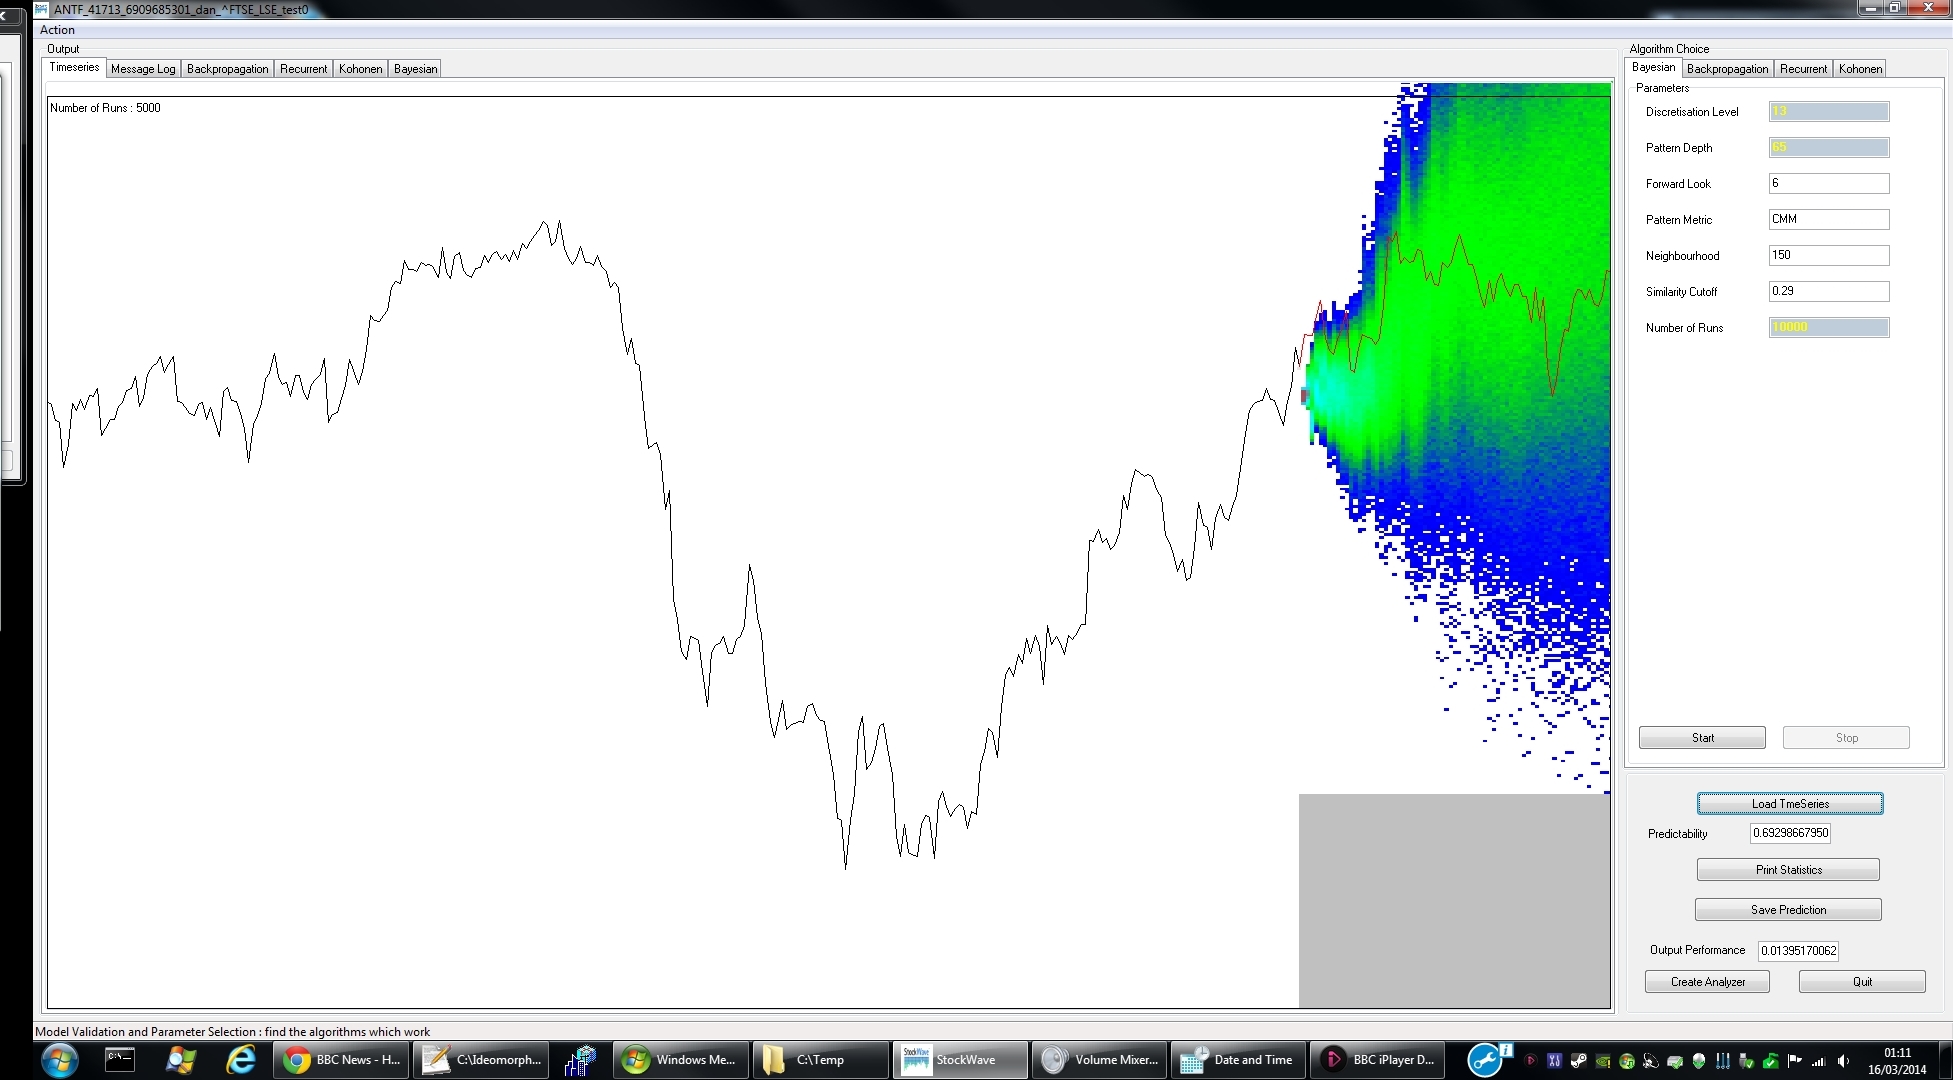
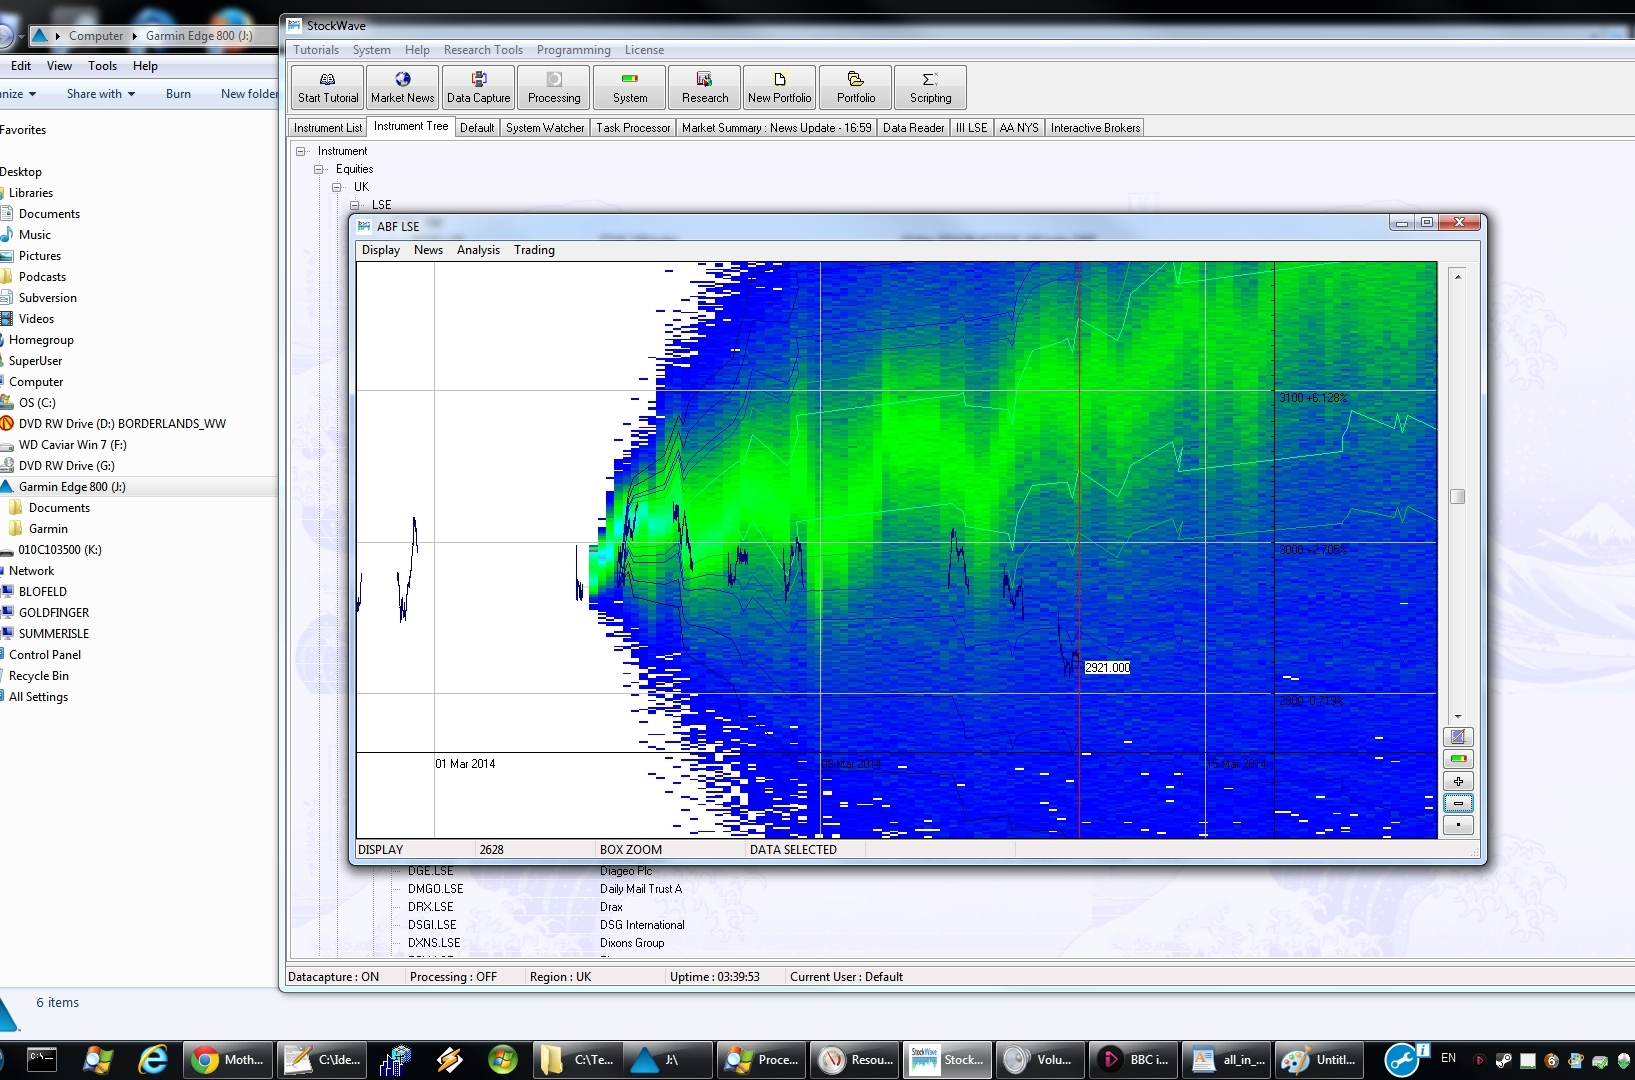
StockWave can do a lot better - our novel machine learning, incorporating deep learning and bayesian techniques can produce more sophisticated results - see our gallery
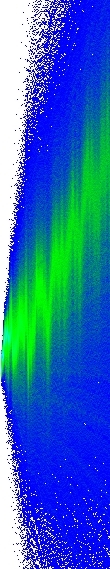
The spread of values still exists but note the substructure appearing within it.
Getting it?
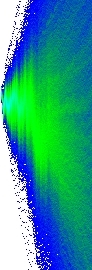
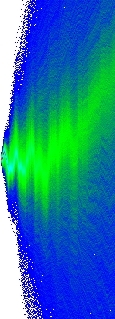
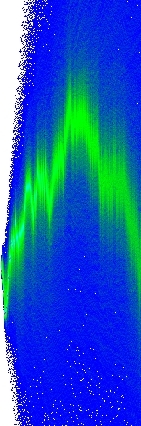
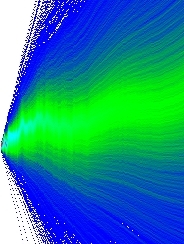
You see the idea, what we're getting at. Even knowing the right direction to bet - up or down, more often than not is worth something.
The turning points which appear can give targets, entry and exits, if you are a swing trader.
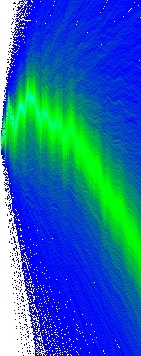
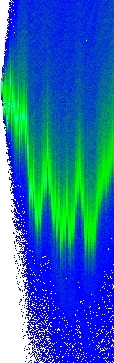
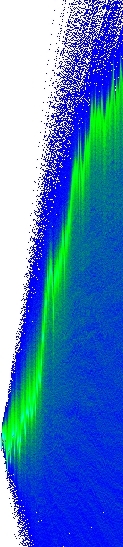
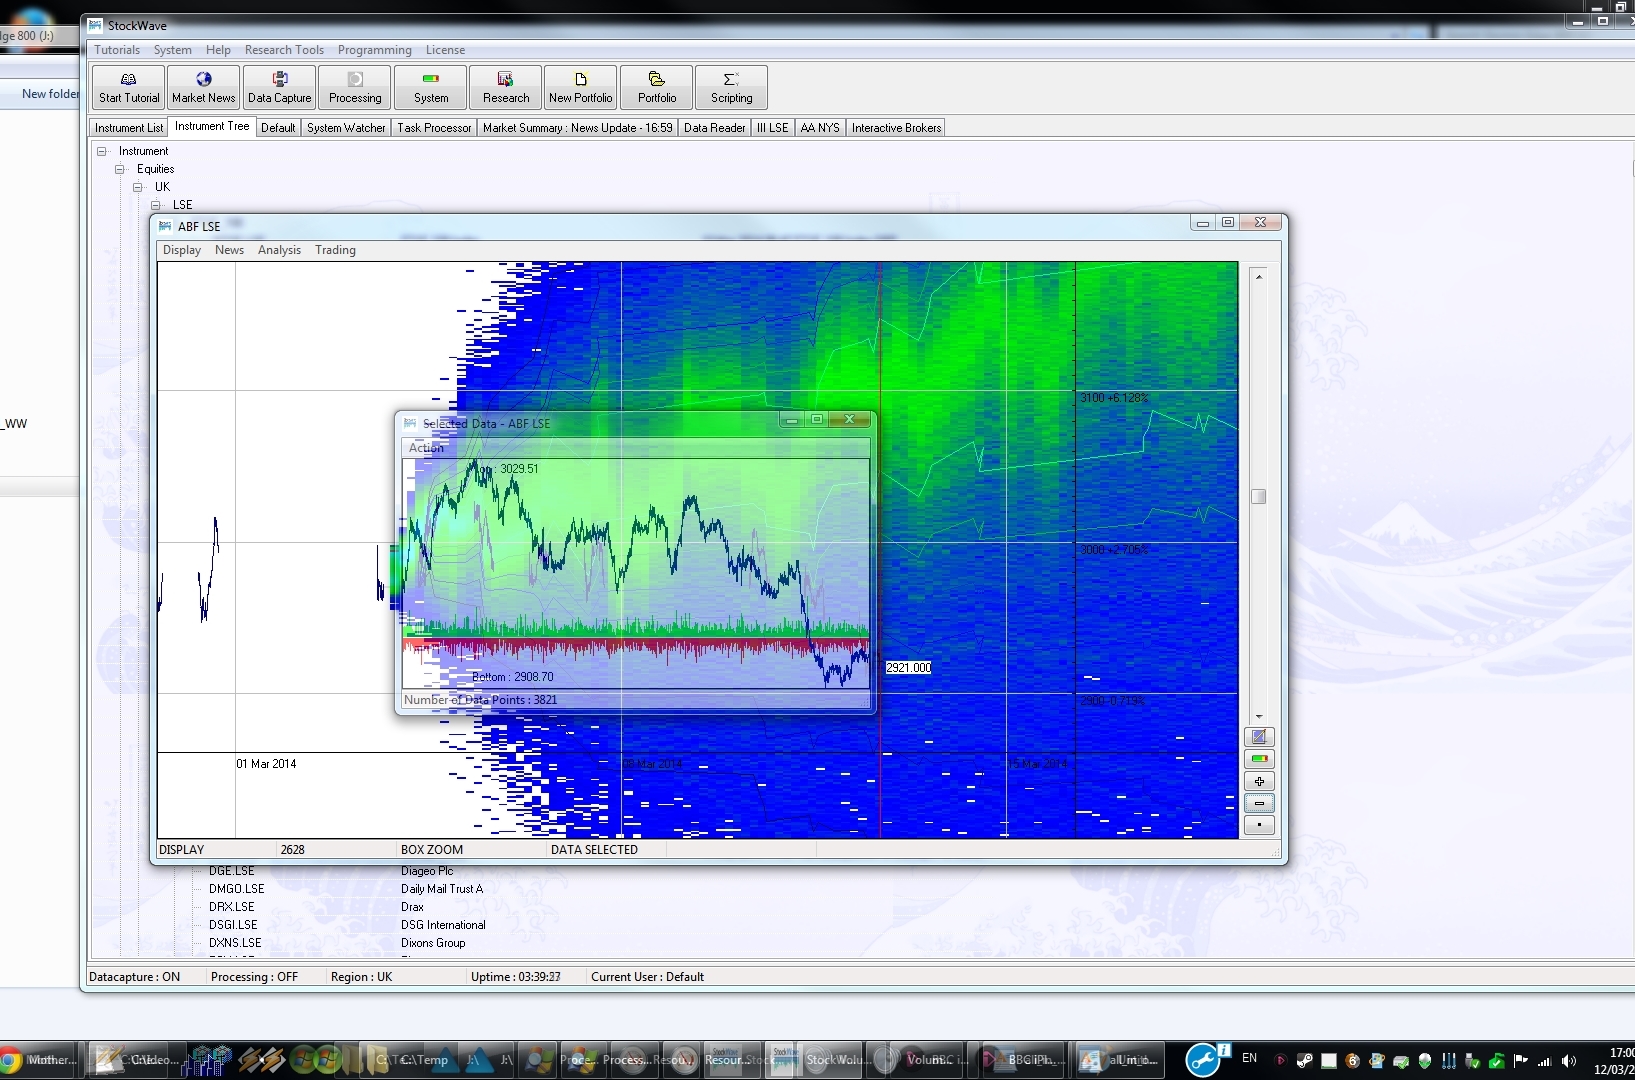
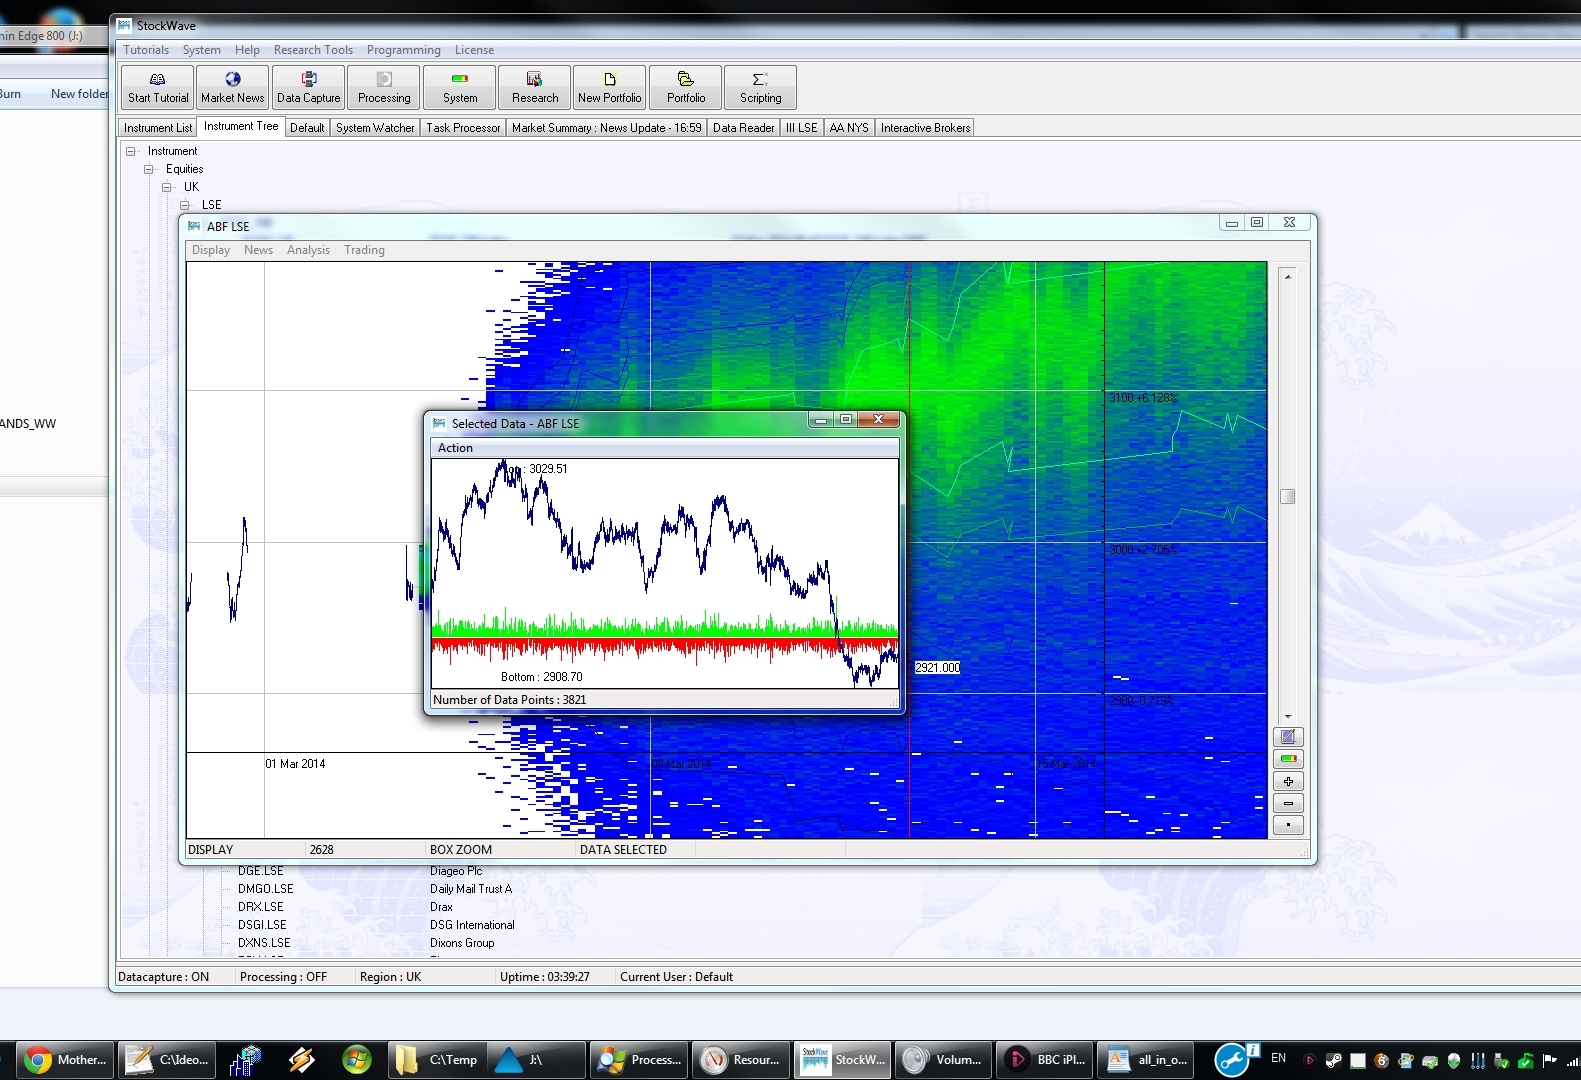
And to show we're not cheating, here's some along with charts of the input price series.
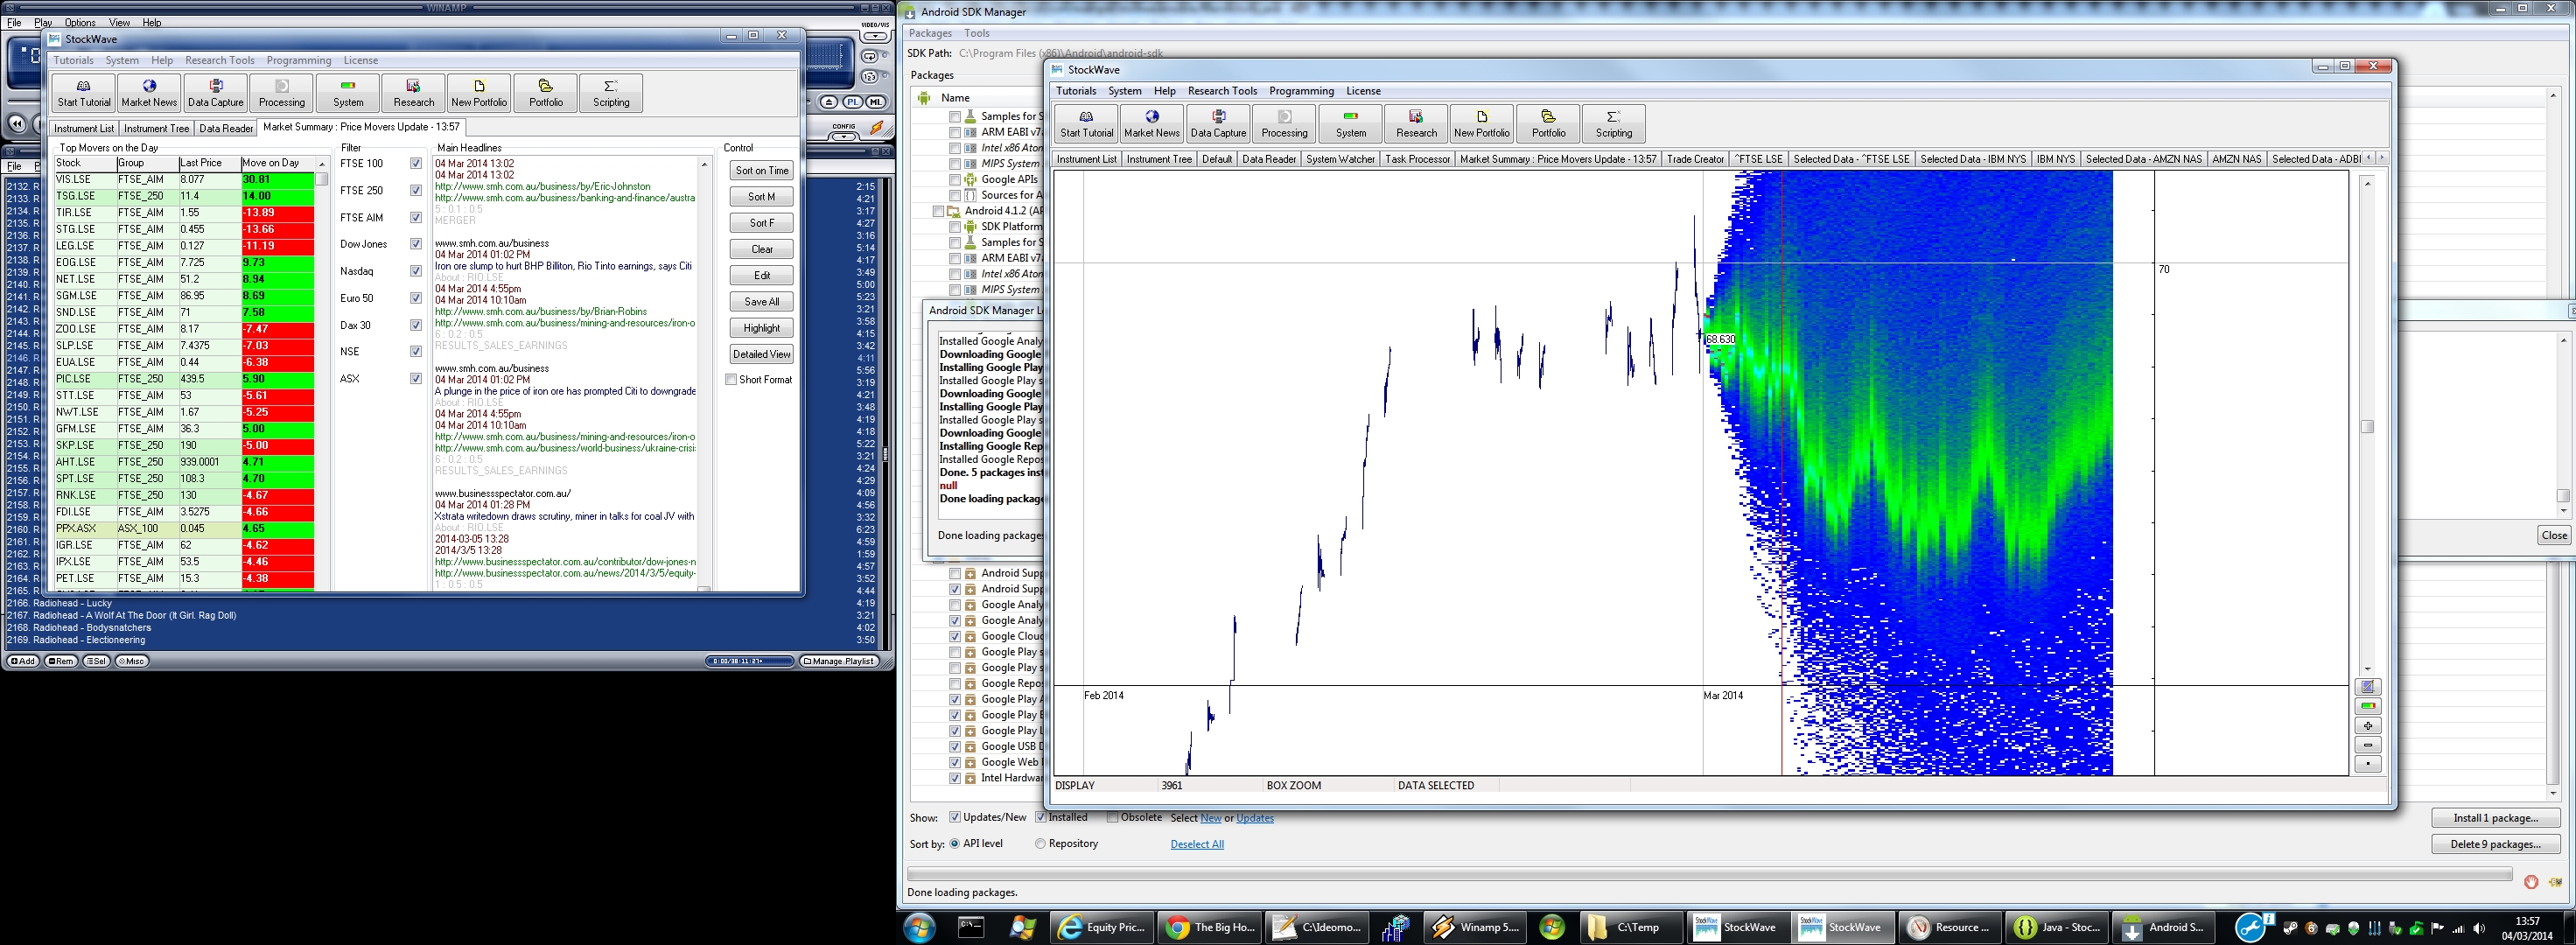
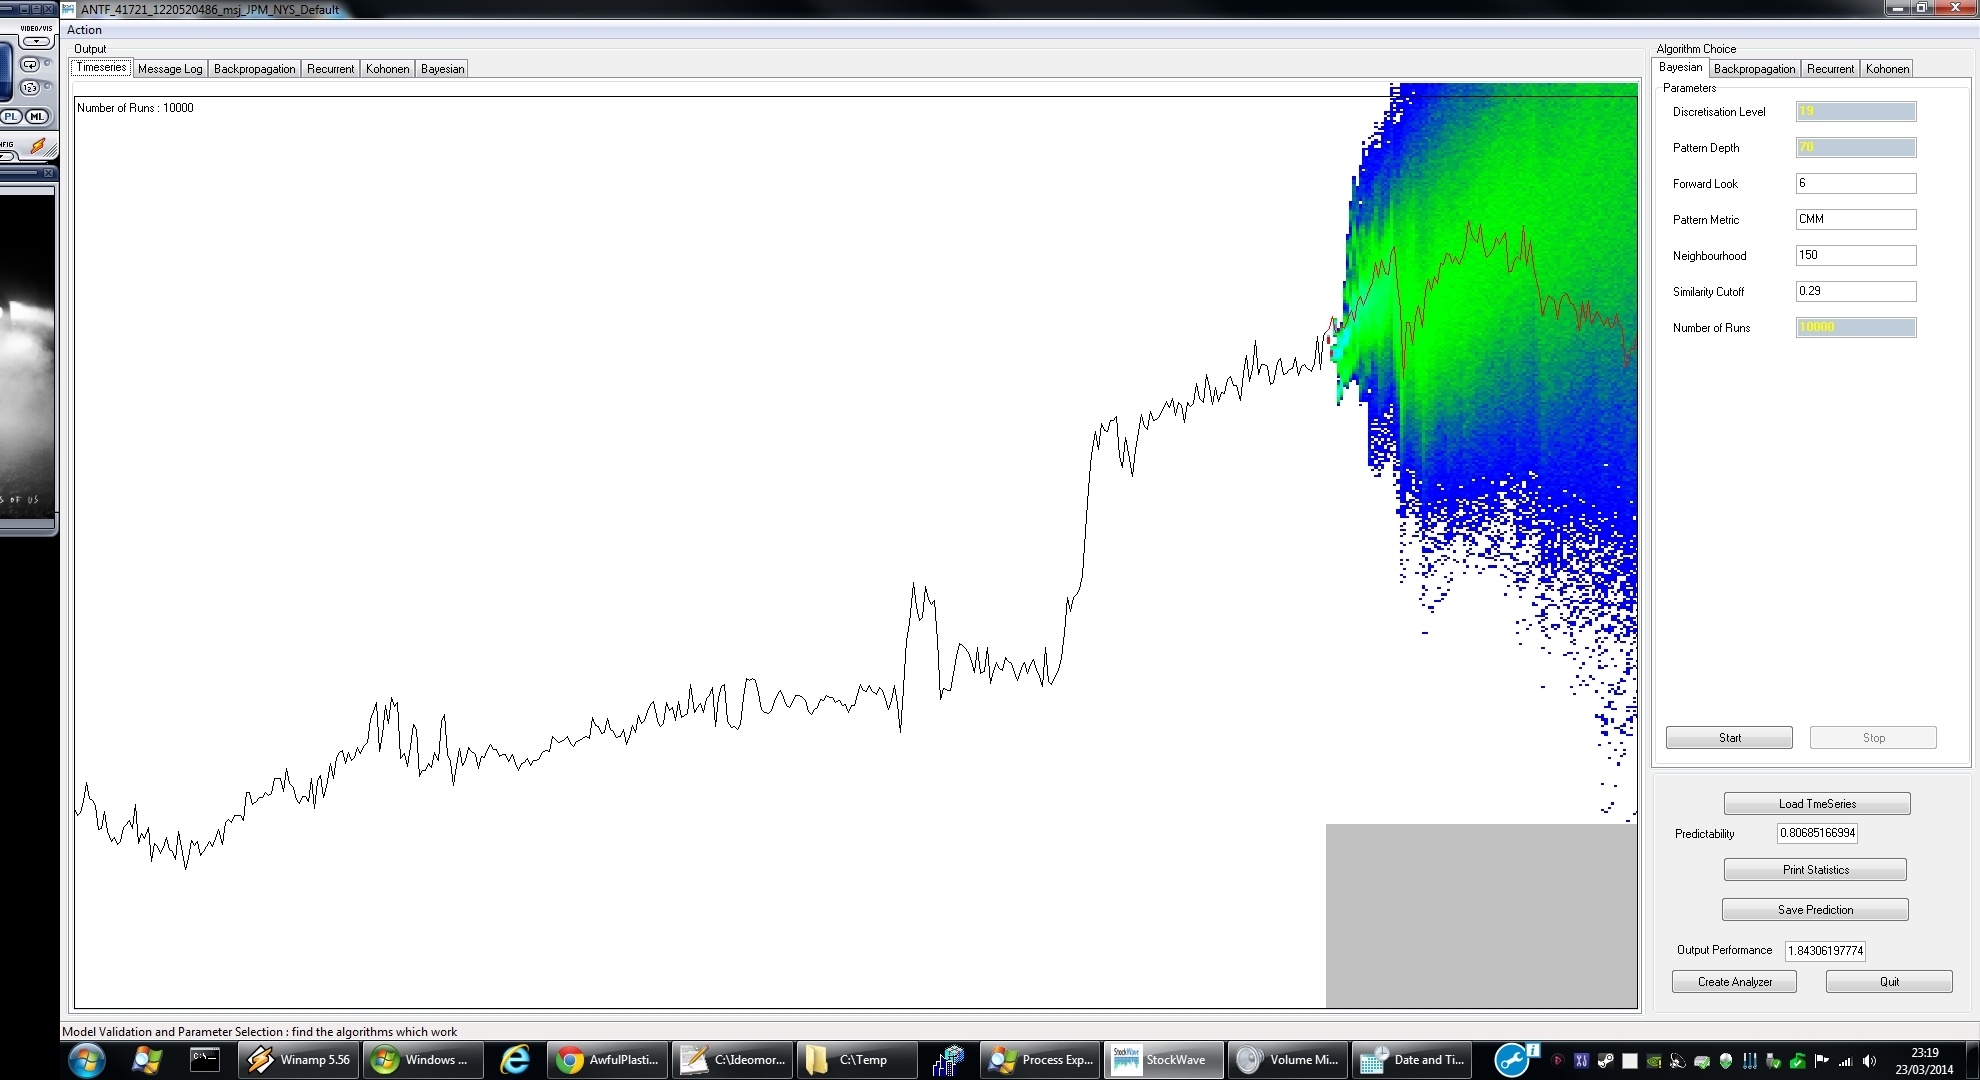
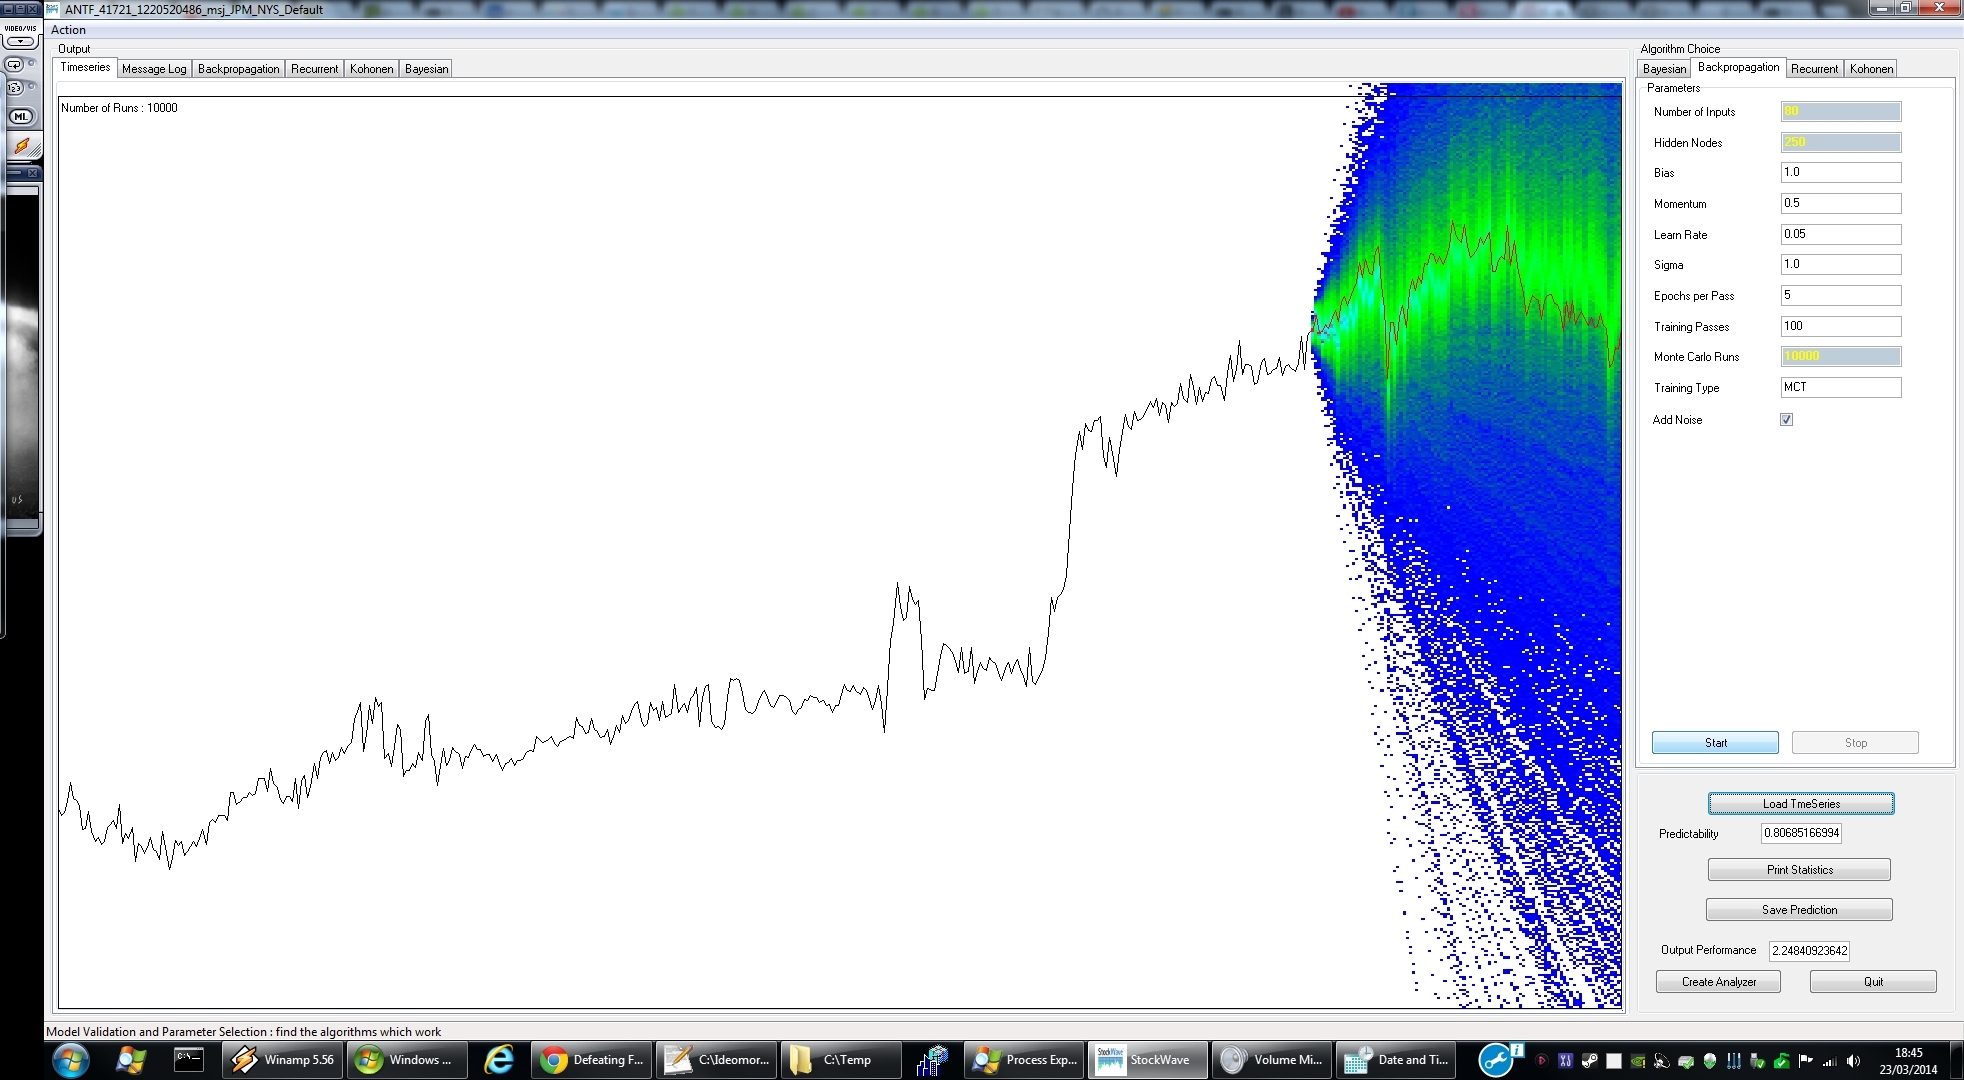
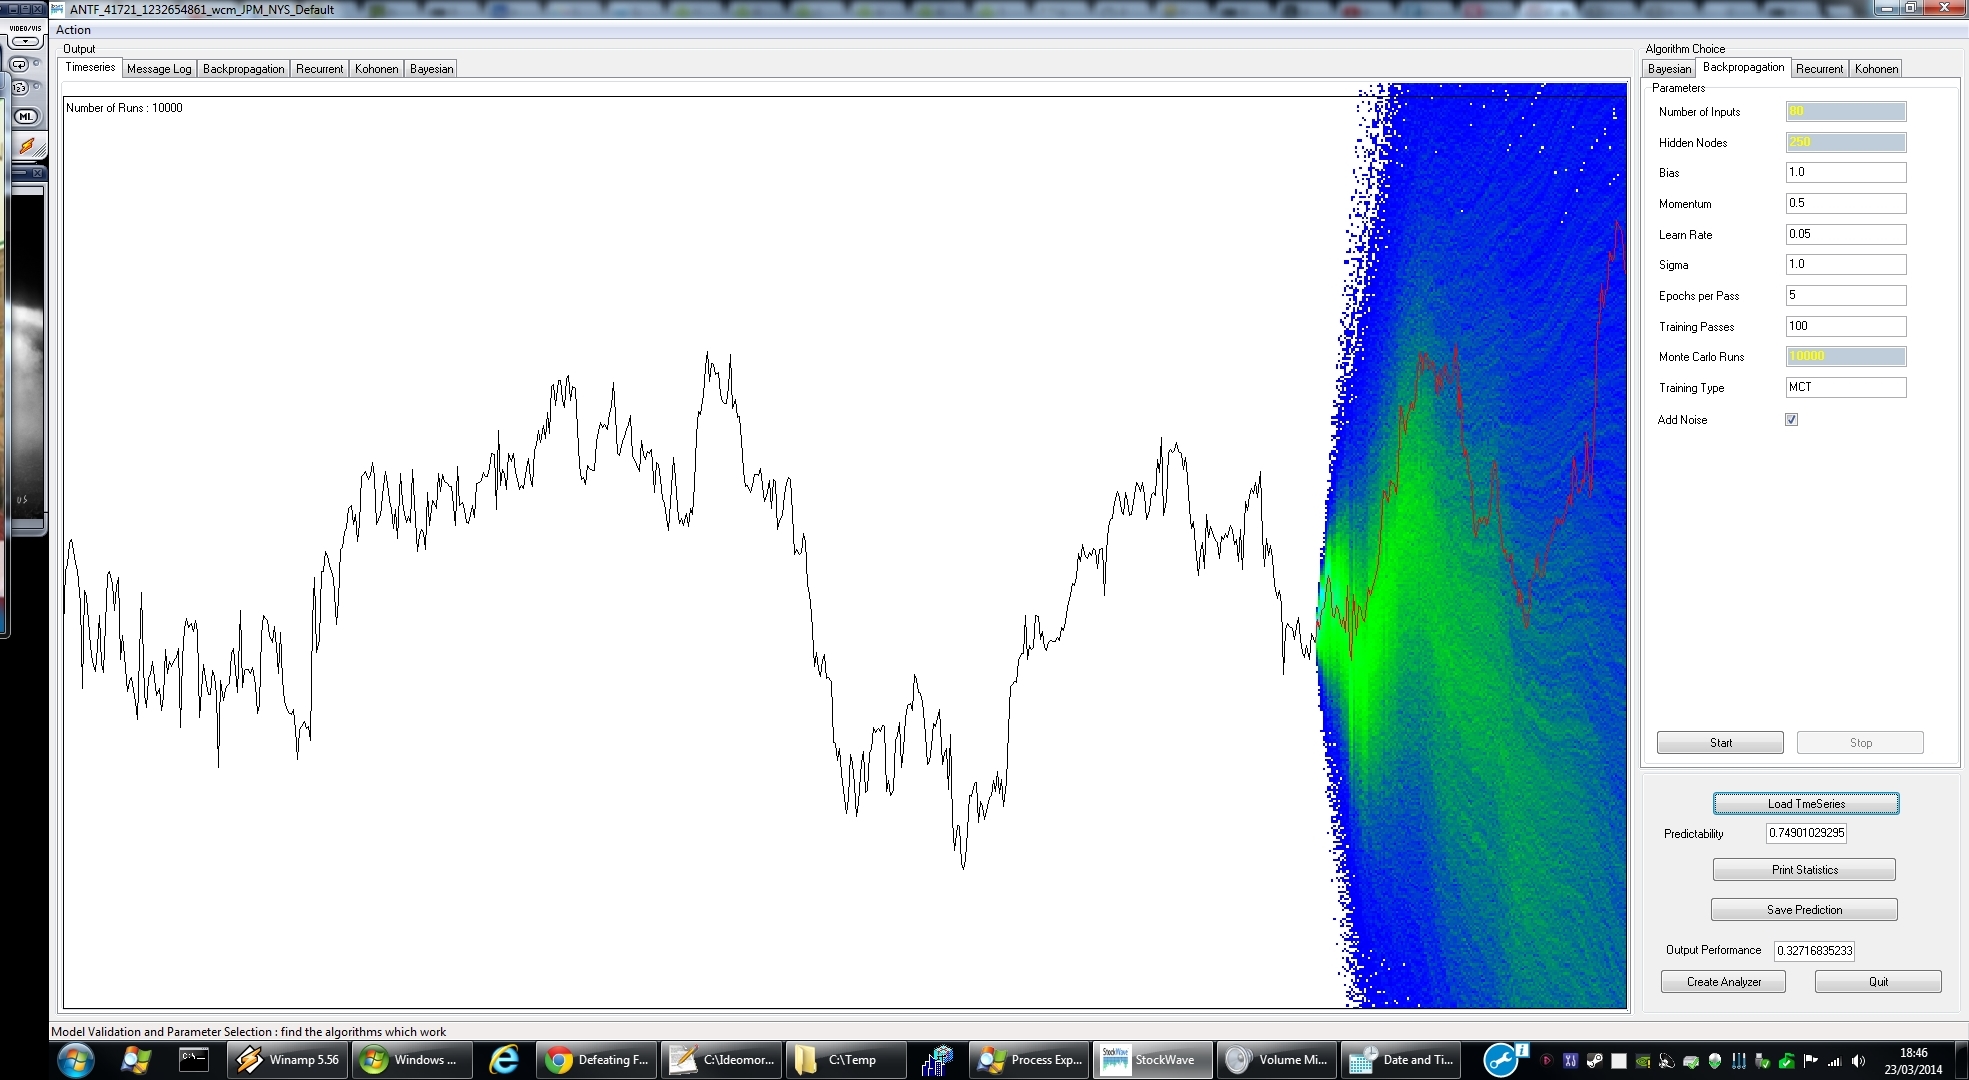
Overlaid on a chart as well - note the non-exact matchups as the chart prices have gaps in them due to trading hours switching on and off.
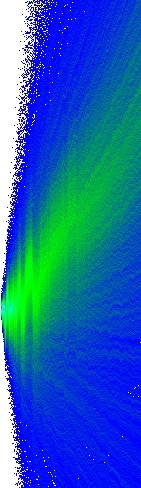
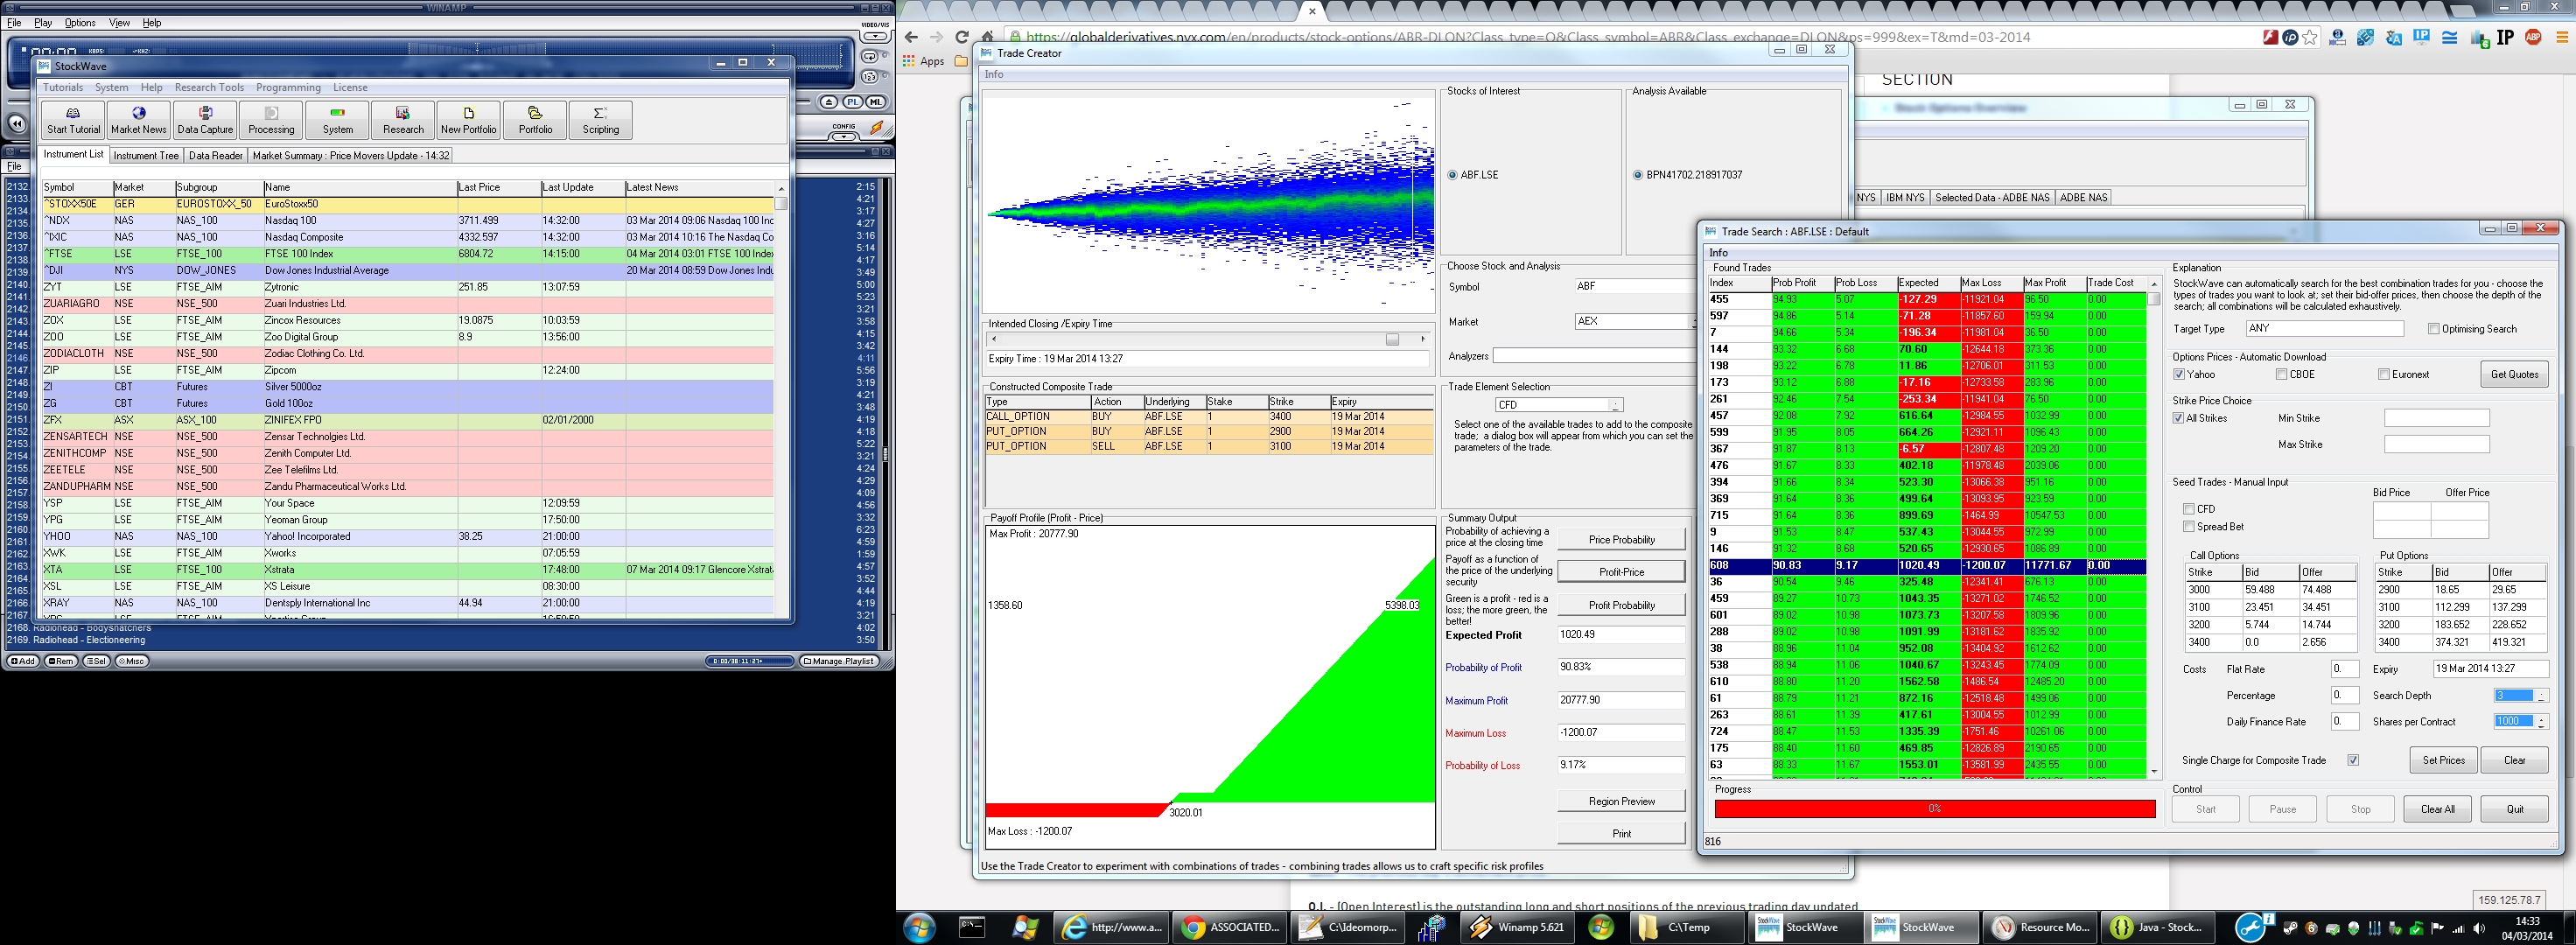
Hope you liked that. We think it's cool. What you should do with it is now - don't just eyeball and make a trade based on your gut - maintain the computational approach, i.e. look for the best, most sophisticated trade you can which will optimise your profit - and we can do this. Our algorithms can examine a vast search space looking for custom trades or "spreads" using your own custom heatmap.
Once you have a better Probability Model, you then find the best combination trade which mazimises your profit
Generating all these pretty pictures is not quick or easy (- and you need good hardware to run our software, which is not cheap either) - and whatever we produce algorithmically we must temper with a good dose of commonsense and Murphy's Law - thus we are looking for the more sophisticated investor who has already been round the block a few times, investigating "systems" and "indicators", has decided it doesn't work and wants something newer, at the cutting edge. Please don't ask us how to write a moving average crossover system or how to upload a model to quantopian - you will have missed the point entirely.
Notes[0] Banking is a unique entity, one in which those responsible for its worst catastrophes are given free reign to provide "solutions" to the problems they caused; nor is the "blame game" often played, fines maybe, jailtime never. Notably the solutions the bankers provide usually involve squaring off their losses and paying their own bonuses. And that's just to begin with, next there is the free money to the well-connected, austerity for the citizen.
[1] Jamie Dimon, head weasel of JP Morgan was "cross-examined" at a recent US government hearing; it went something along the lines of this - interviewers : "are you maybe a little bit crooked perhaps, (sorry for bringing it up)?" JD - "No, I'm just really really smart, much smarter than any of you guys" "that's alright then, carry on, thank-you for your time, sorry for bothering you"
[2] the only other holy grail of investing is the use of illegal insider information; never mind "card counting", simply look at the other guys hand ...