|

|
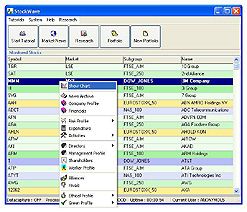
Main Window
From here, you can access everything that you
need. You can see a list of stocks and select
one. Various options are shown on the
right-click menu. For example, you can choose
to show the chart.
The pastel colours serve a purpose; the three
geographical areas are identified by a
colour, for example, green for UK stocks,
blue for US stocks, and orange for European
stocks. The darker the shade, the larger the
company.
|

|
|

|
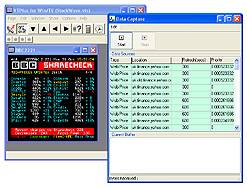
Data-Capture
Data sources are held here and updated from
time-to-time in priority (oldest first). You
can decide how often to capture data. For
example, you might decide to visit one data
source every 5 minutes — and another
every 25 minutes.
You can get data from Teletext and the
Internet, and everything can be configured to
your taste and your PC's settings. This means
StockWave™ can accommodate both the
power user and the not-very-powerful-at-all
user. The point of this is to shorten the gap
between the serious almost-professional
investor or trader — and the
ordinary-ish Joe.
It's worth pointing out that you can get data
from different types of sources, for
different stocks, which can be easily
tailored to your needs, simply by casting a
wide net. It's also possible use an existing
subscription.
|

|
|

|
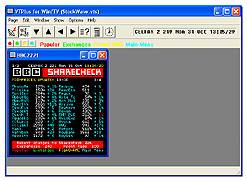
Teletext
StockWave™ can use the Teletext
application that comes with Hauppauge WinTV
cards.
Teletext is a great way to get data —
and is often overlooked. If you've got a
low-specification PC, or would be a casual
user, this feature is ideal for you. It's
free!
|

|
|

|
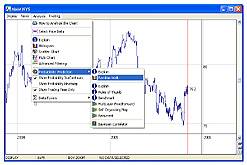
Charting
The chart is at the centre of
StockWave™ — looking at the share
price is your main activity. You may zoom in
and out, select data for analysis, and view
the analysis that you've done.
|

|
|

|
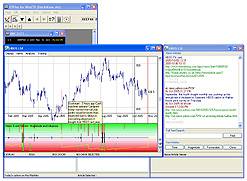
Chart with integrated News
Viewing
You can also see news events as they relate
to share prices, and by moving the cursor
over the chart, see when a news event
happened.
You can get a feel for what affects prices
— some things do, some don't.
|

|
|

|
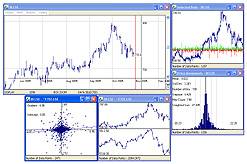
Basic Analysis Tools
From the chart, you can access various
analytical tools. The screenshot shows the
data that has been selected for analysis; a
histogram showing the distribution of price
movements; a multi chart showing the stock
plotted against another; and a scatter chart
showing how movements are related to
movements in another stock.
|

|
|

|
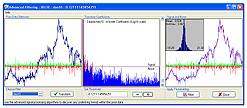
Advanced Filtering
Using advanced filtering, you can apply
signal processing techniques to your
data.
The aim is to separate the underlying trend
from the noise.
|

|
|

|

|
Probabilistic Prediction
Ideally, you want to know where a share price
will go in the future. Unfortunately,
predictions of this kind are pretty much
impossible, given the nature of share
prices.
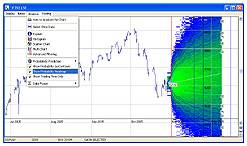
What is possible, however, is calculating
probabilities (or 'true odds') of where the
price is likely to go. The technique used is
called 'Monte Carlo simulation,' and its
output is shown on the chart.
The hotter regions show where the share price
is more likely to go. And, once you know the
true odds, you can create a profitable
trading strategy.
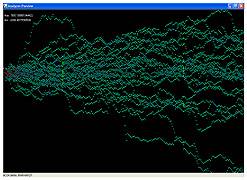
The second screenshot shows a Monte Carlo
simulation that has just started. You can see
the paths of the individual random walks. The
probabilistic prediction overlay has contours
showing the probability (in percent) that the
price will be, within the boundaries on a
given day.
|

|
|

|
Task Processor
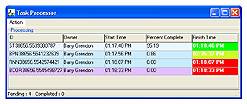
Several types of Monte Carlo simulation are
available — some of which are very
processor-hungry. To make the application
usable during the number crunching, all heavy
work is carried out in background threads and
held in the task processor.
The progress of each job is shown, as well as
the likely finish time. If a job is taking
too long, you can pause or delete it.
|

|

|

|
Portfolio Window
Each user's trading interests are held in
their portfolio. You can select a portfolio
using the menu and look at the trades they've
made, analyse what they've done, and see the
status of any trade alarms. Open positions
are updated in real-time if data-capture is
running.
|

|
|

|

|
Trade Creator
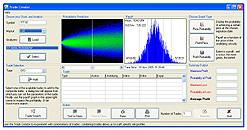
The trade creator is probably the most
important tool — certainly it is the
most complex, and the crux of the whole idea
of StockWave™. It lets you select any
piece of analysis, plus any possible trades
that you could make, and have the payoff
calculated and displayed.
On the payoff graph, red is a loss and green
is a profit. Breakeven points are shown by a
cross. Trading costs, if known, can be
incorporated into the calculation.
The point of this is to help you make profits
with high-probability trades.
The trade creator handles different types of
trade — CFDs, spread bets and
options.
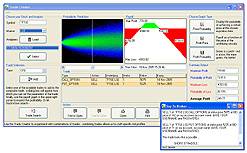
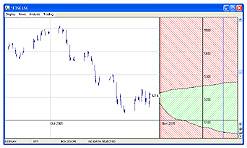
In the second screenshot, there's a 'short
strangle' combination trade. This is an
options trade which involves selling a Call
option and a Put option. Making this trade
means that you'll profit if the share price
stays between two prices, but make a loss if
it finishes outside either edge.
Note that the profit level is capped, while
potential losses grow with the distance
outside the green region. Red triangles on
the payoff graph show danger — and a
short strangle has two of these.
When you're ready, you go onto make a trade.
It's entered into your portfolio, where you
may inspect it. Open trades are shown in red
and closed trades in green. Current profit or
loss is shown and indicated similarly.
(You aren't actually making a trade here
— you need to go to your online broker
and make the trade there; StockWave is not
yet a trading platform.)
The complex possibilities of the various
combinations are overwhelming. To solve this
problem, there's the trade searcher.
|

|
|

|
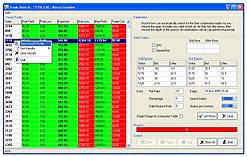
Automated Trade Searcher
This takes a number of seed trades (for
example, from an options table), then
exhaustively calculates the payoffs for all
combinations, to a given depth (up to a
maximum of six).
The best trades are on the left hand side.
You can select one of these and view it in
the trade creator.
|

|
|

|
Trade Alarm
When a trade is created, a trade alarm, which
knows the 'safe' and 'dangerous' regions for
that share price to go to, is set up.
Generally speaking, the deeper into a region
a price goes, the better / worse you'll
fare.
If the price stays in the green, you'll be in
profit at closing time. If your trade starts
to wander off track, an alarm will be sent to
your mobile phone.
It's simple; do some analysis, find the
trades with the best chance of payoff, set
the alarm, then make sure the price stays in
the green.
|

|
|

|

|
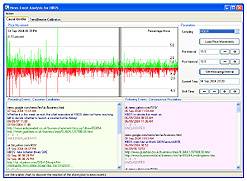
News Event Analysis
Most of what makes share prices move as they
do is probably already in the share price
itself — but not always.
News events are shown alongside the chart to
let you see if there's anything that may be
having a special effect. This is a useful
visual check. However, StockWave™ goes
further by offering definite quantitative
assessment of the effects of news events on
the price.
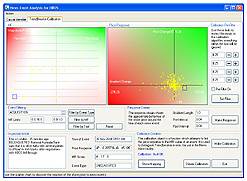
The scatter chart lets you take a sample of
news events and see what the actual price
response was; the right hand side shows the
price response and the left hand side shows a
graph of the expectation.
Again, red and green are used to show 'good'
and 'bad.' News events are shown as crosses.
When you move the cursor over them, you get a
text display of what it actually was.
|

|
|

|
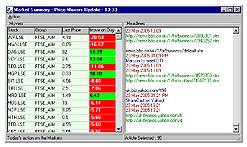
Market Summary
The market summary shows the biggest share
price movements — up or down —
plus the day's headlines.
Clicking on a headline lets you browse the
original data source.
|

|
|

|
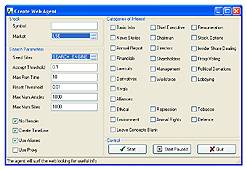
Web Agent
Create your own program to dig deep for
information about a company's prospects and
operations.
Most publicly-traded companies are large,
complex beasts with a very great deal going
on inside them.
If you want to think about fundamentals, then
simply looking at the company report is not
enough — you've got to look deeper to
gather and evaluate information from a
variety of sources. This is called the
'scuttlebutt approach to investing.'
|

|
|

|
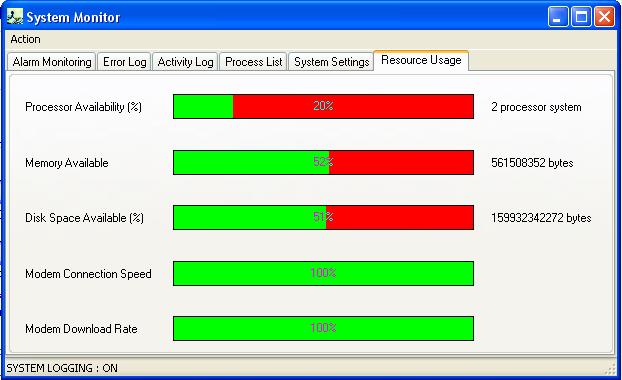
System Sentinel
StockWave™ can easily use-up whatever
resources your PC has �
and can do a lot of thing simultaneously; the
sentinel is a centralised monitoring facility
that will help you get the best out of the
machine you've got.
The system sentinel lets you check system
loading, recent activities, and also any
error messages, for example, with a data
source that's not responding.
|

|
|

|
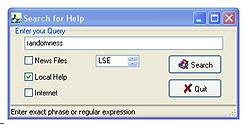
Local Help
There are full text search facilities for the
StockWave™ help files and its news
archives.
|

|
|

|
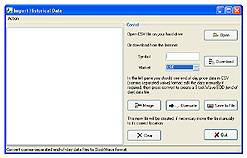
Import Historical Price Data
Get end-of-day price data from any free
Internet data sources.
|

|
|

|
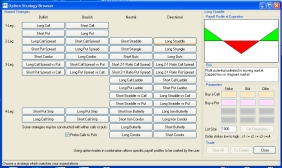
Options Strategy Browser
See payoff profiles for 40 options
strategies.
|
